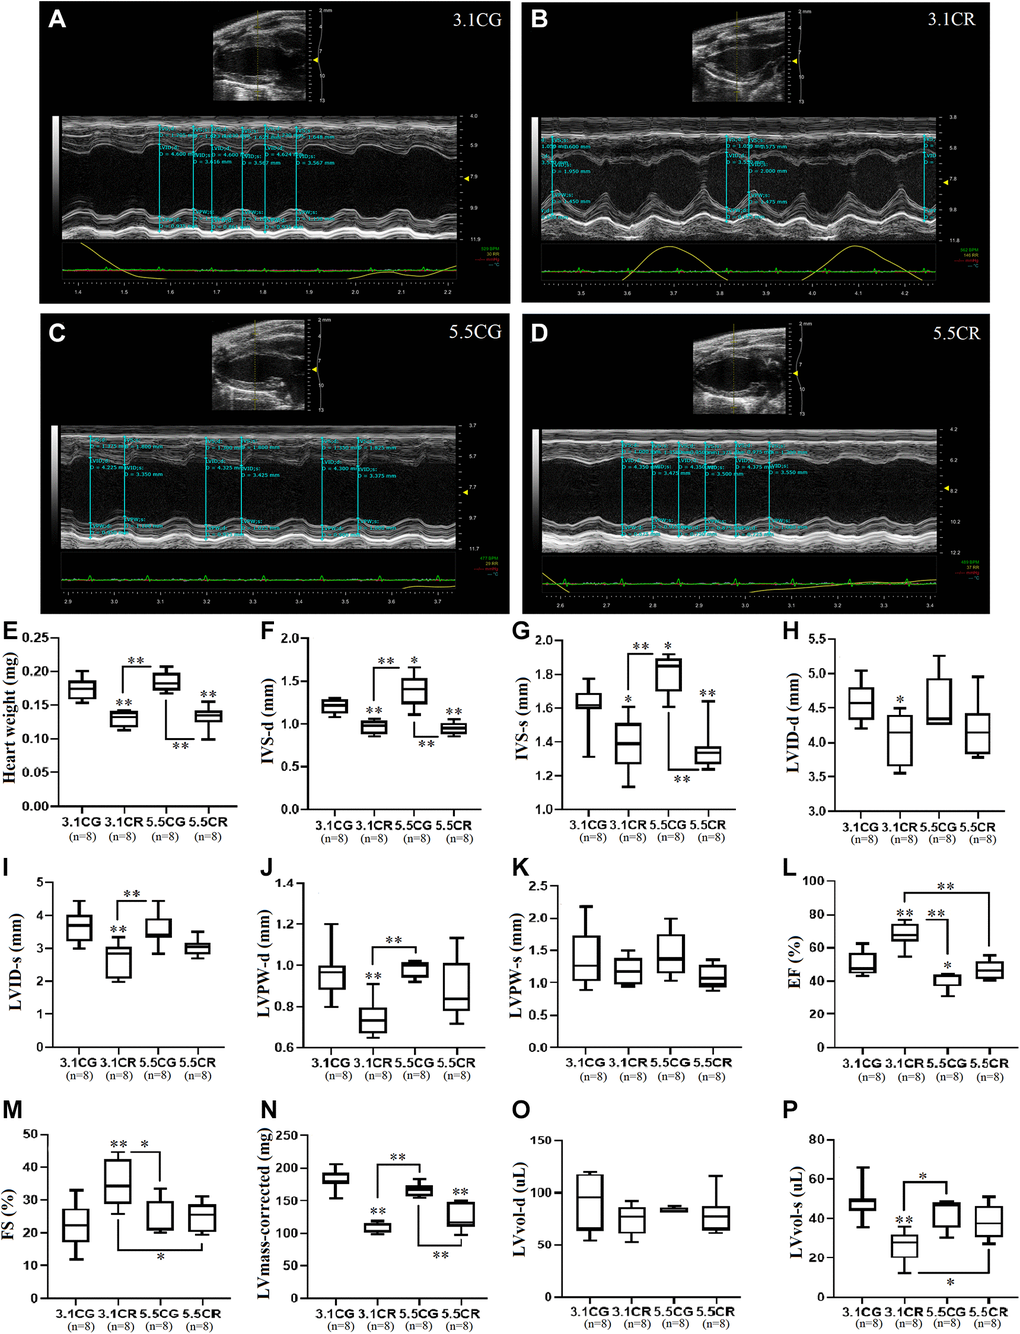
Figure 3.Transthoracic echocardiographic measurement. Representative M-mode echocardiographic images and measurements acquired with the FUJIFILM VEVO 3100 imaging system. Images were acquired in the LV PLAX view for the 3.1CG (A), 3.1CR (B), 5.5CG (C), and 5.5CR (D) groups. Vevo LAB 3.1.0 image analysis software was used to automatically calculate the weight of the hearts of mice, expressed in mg (E); IVS-d, expressed in mm (F); IVS-s, expressed in mm (G); LVID-d, expressed in mm (H); LVID-s, expressed in mm (I); LVPW-d, expressed in mm (J); LVPW-s, expressed in mm (K); EF, expressed in % (L); FS, expressed in % (M); corrected LV mass, expressed in mg (N); LVvol-d, expressed in μl (O); and LVvol-s, expressed in μl (P). The data are the mean ± SD. *P < 0.05 and **P < 0.01 vs. the 3.1CG group, unless otherwise specified. After echocardiographic measurements, mice were sacrificed by the cervical dislocation technique. The hearts were collected and weighed after complete removal of blood via washing with excess ice-cold PBS.