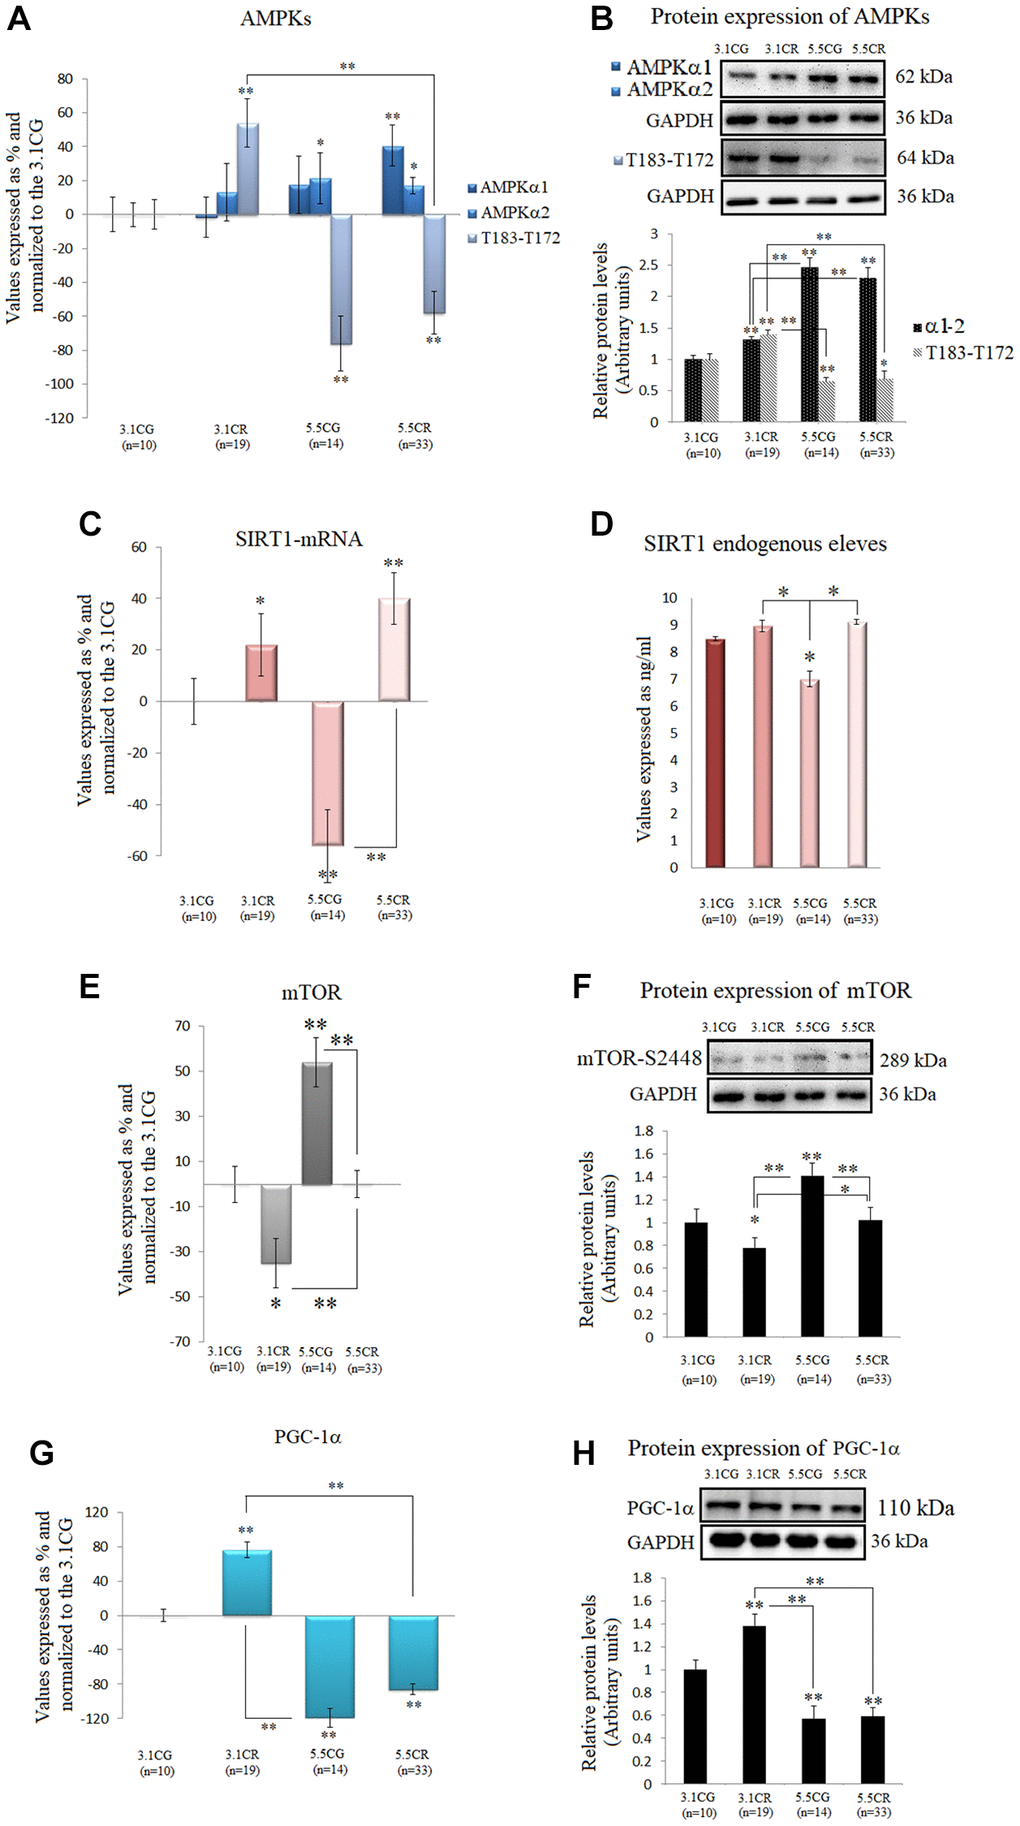
Figure 5.Expression of the AMPK-SIRT1-mTOR-PGC-1α nutrient sensors. The isoforms of the catalytic α-subunit of AMPK were analyzed by (A) qPCR (mRNA levels) and (B) Western blotting (protein levels†). T183-T172: AMPK α1 phosphorylated at T183 and AMPK α2 phosphorylated at T172. SIRT1 mRNA expression (C). SIRT1 endogenous levels (D). mTOR mRNA expression (E). Protein levels of mTOR phosphorylated at S2448† (F). PGC-1α mRNA expression (G). PGC-1α protein levels (H). mRNA expression in the WHT was analyzed by qPCR with SYBR Green fluorescence detection, and the transcript levels of the target genes were normalized to those of the endogenous control 18S rRNA. For each group, the value is expressed as a percentage (%); the 3.1CG value was set to 0, and the values for the rest of the groups were normalized to this level for comparison. Immunoblot results and protein expression results were obtained by Western blot analysis and quantified with Image Lab 6.1 software. The values were normalized to GAPDH expression; the 3.1CG expression was set to 1.0. The data are the mean ± SD. *P < 0.05; **P < 0.01 vs. the 3.1CG group, unless otherwise specified. †AMPKα1-α2 and mTOR-S2448 share the same GAPDH loading control.