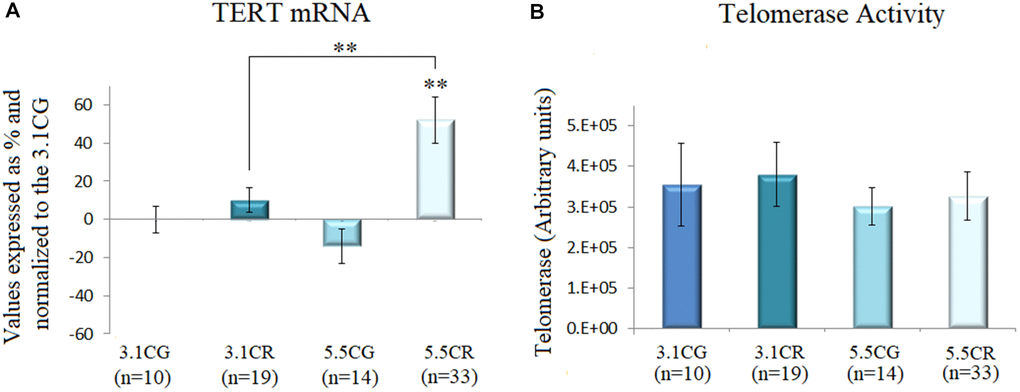
Figure 6.Telomerase activity. TERT mRNA expression (A). cDNA was obtained from WHT with a Takara RR047Q kit. qPCR was performed with 100 ng of target DNA. Significant differences in gene expression between groups are expressed as percentage (%) values. For each gene expressed as %, the 3.1CG value was set to 0, and the values in the compared samples were normalized to this level. Positive % values represent upregulation. Negative values represent downregulation. Each marker was analyzed with SYBR Green fluorescence detection, and the transcript levels of the markers were normalized to those of the endogenous control 18S rRNA. Telomerase activity (B) was assayed with a TRAPeze RT Telomerase Detection Kit (Millipore) for fluorometric detection and real-time quantification. The telomerase values are arbitrary units relative to TSR8 amplification, as specified in the manufacturer’s manual. The data are the mean ± SD. *P < 0.05; **P < 0.01 vs. the 3.1CG group.