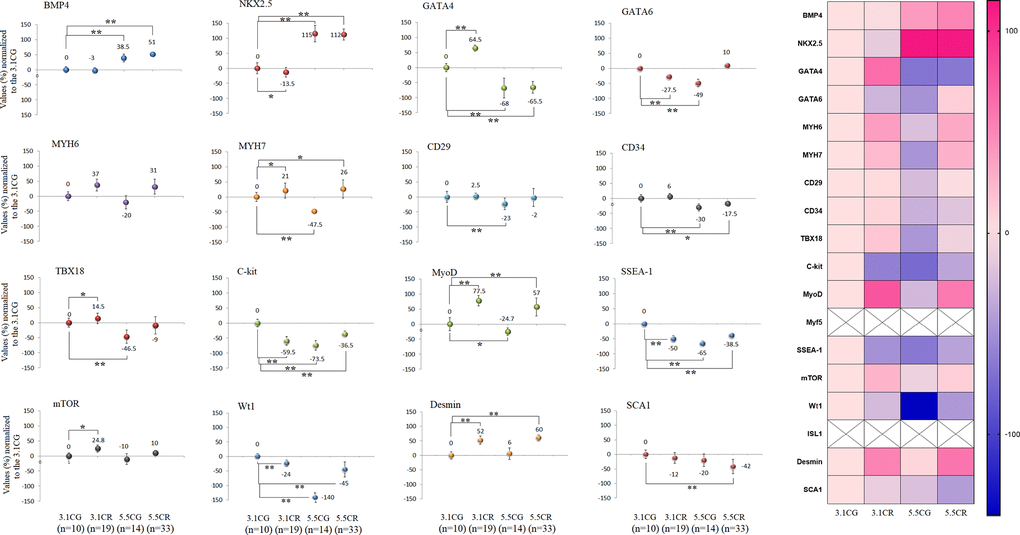
Figure 8.Expression of CPC- and CSC-related markers. cDNA was obtained from WHT with a Takara RR047Q kit. qPCR was conducted with 100 ng of target DNA. Significant differences in gene expression between groups are expressed as percentage (%) values. For each gene expressed as %, the 3.1CG value was set to 0, and the values of the compared samples were normalized to this level. Positive % values represent upregulation. Negative values represent downregulation. Each marker was analyzed with SYBR Green fluorescence detection, and the transcript levels of the markers were normalized to those of the endogenous control 18S rRNA. The data are the mean ± SD. *P < 0.05; **P < 0.01 vs. the 3.1CG group. A hierarchical clustering illustration for the up-/downregulation of genes analyzed from RT–PCR array data is shown on the right side of Figure 8. The right bar depicts the colors for upregulation and downregulation expressed as percentages.