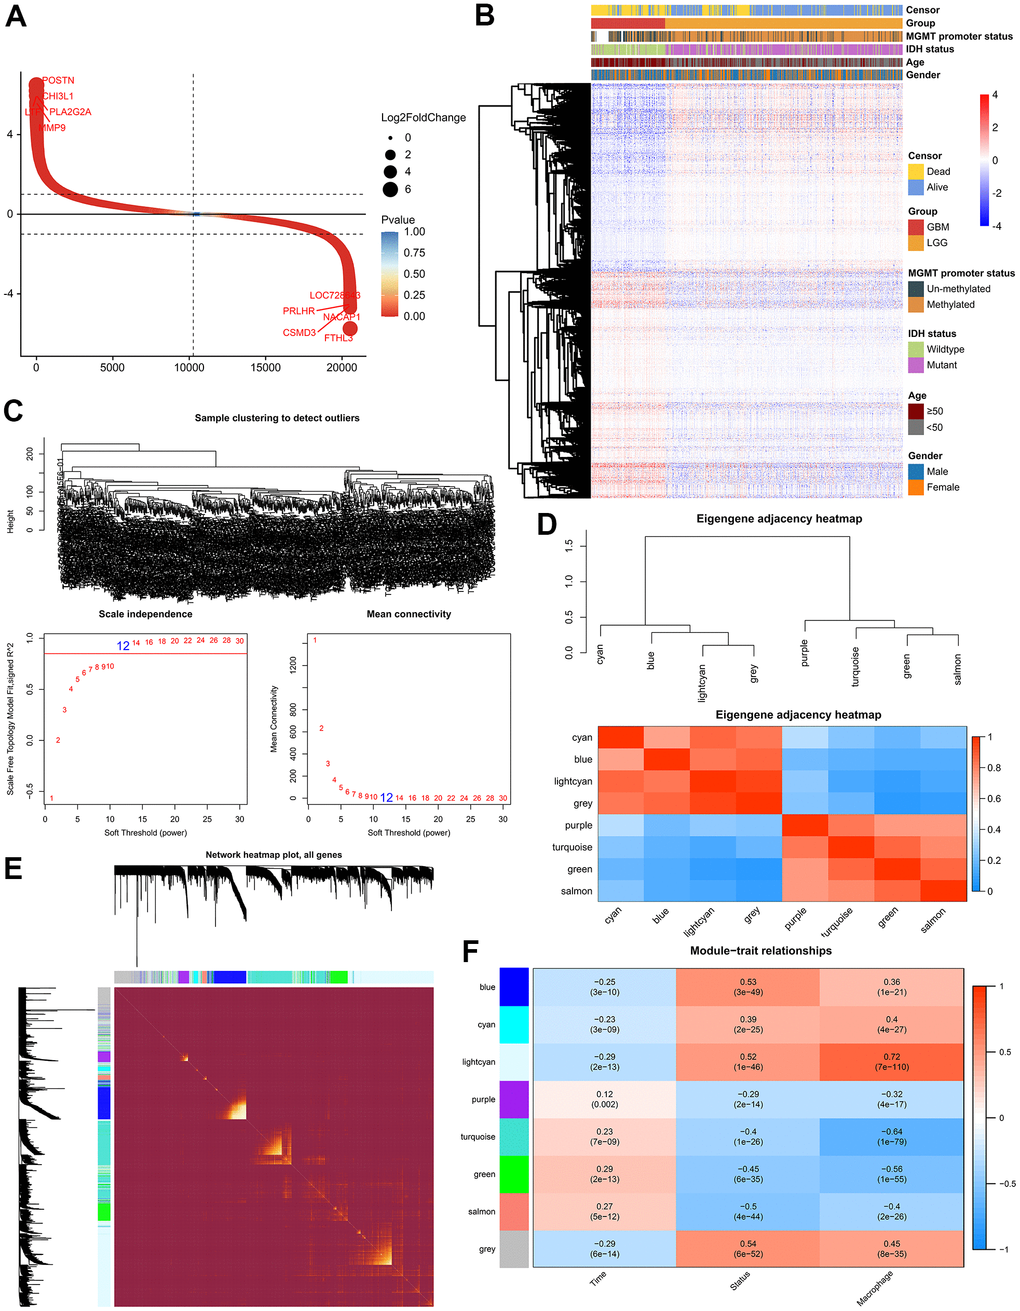
Figure 2.Weighted correlation network analysis. (A) Scatter plot showed 2116 up-regulated genes and 1752 down-regulated genes. (B) Cluster dendrogram demonstrating good separation between LGG and GBM. (C) Sample Dendrogram and soft-thresholding powers. (D) Clustering tree and adjacency heatmap of modules. (E) TOM diagram of the relationship between gene clusters and modules in each module of WGCNA. (F) Module-trait relationships indicated the light-cyan module was most related to the level of TAM in glioma.