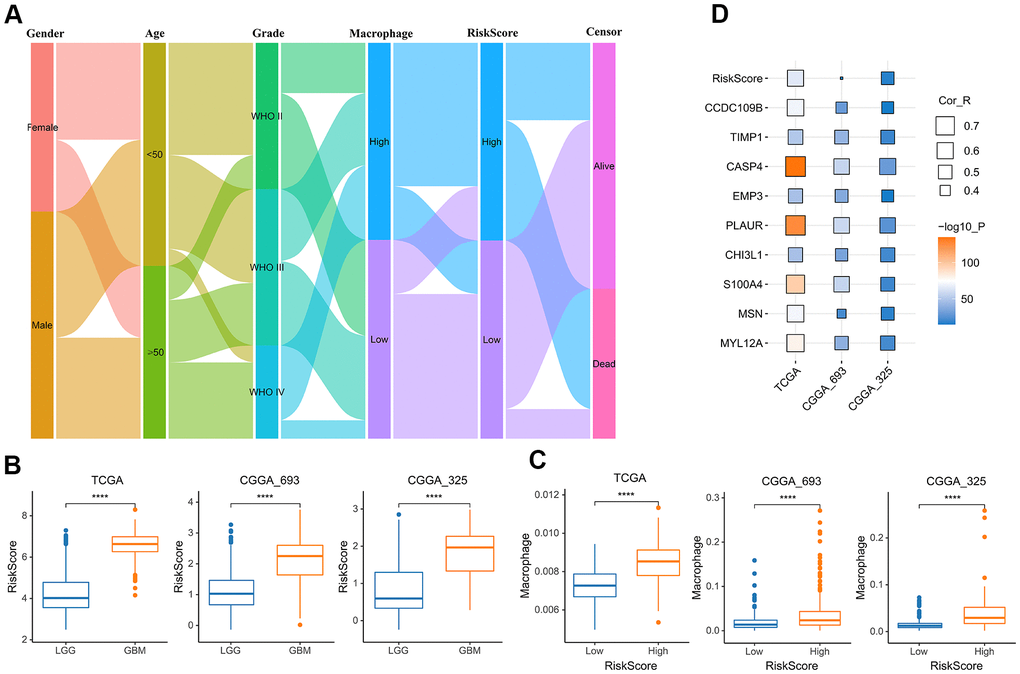
Figure 6.The relationship between risk score and TAM. (A) Sankey Diagram displayed the distribution of the survival status, age, WHO grade, risk score and TAM of glioma patients in the merged GBMLGG cohort. (B) Boxplot showed the risk scores of GBM were higher than those of LGG in the cohort of TCGA merged GBMLGG, CGGA mRNAseq-693 and CGGA mRNAseq-325, respectively. (C) Boxplot showed the TAM of high-risk group was higher than that of low-risk group in the cohort of TCGA merged GBMLGG, CGGA mRNAseq-693 and CGGA mRNAseq-325, respectively. (D) Correlation analysis showed that the risk score and nine prognostic genes were significantly related to TAM in the cohort of TCGA merged GBMLGG, CGGA mRNAseq-693 and CGGA mRNAseq-325, respectively. *, P< 0.05; **, P< 0.01; ***, P< 0.001, ****, P< 0.0001.