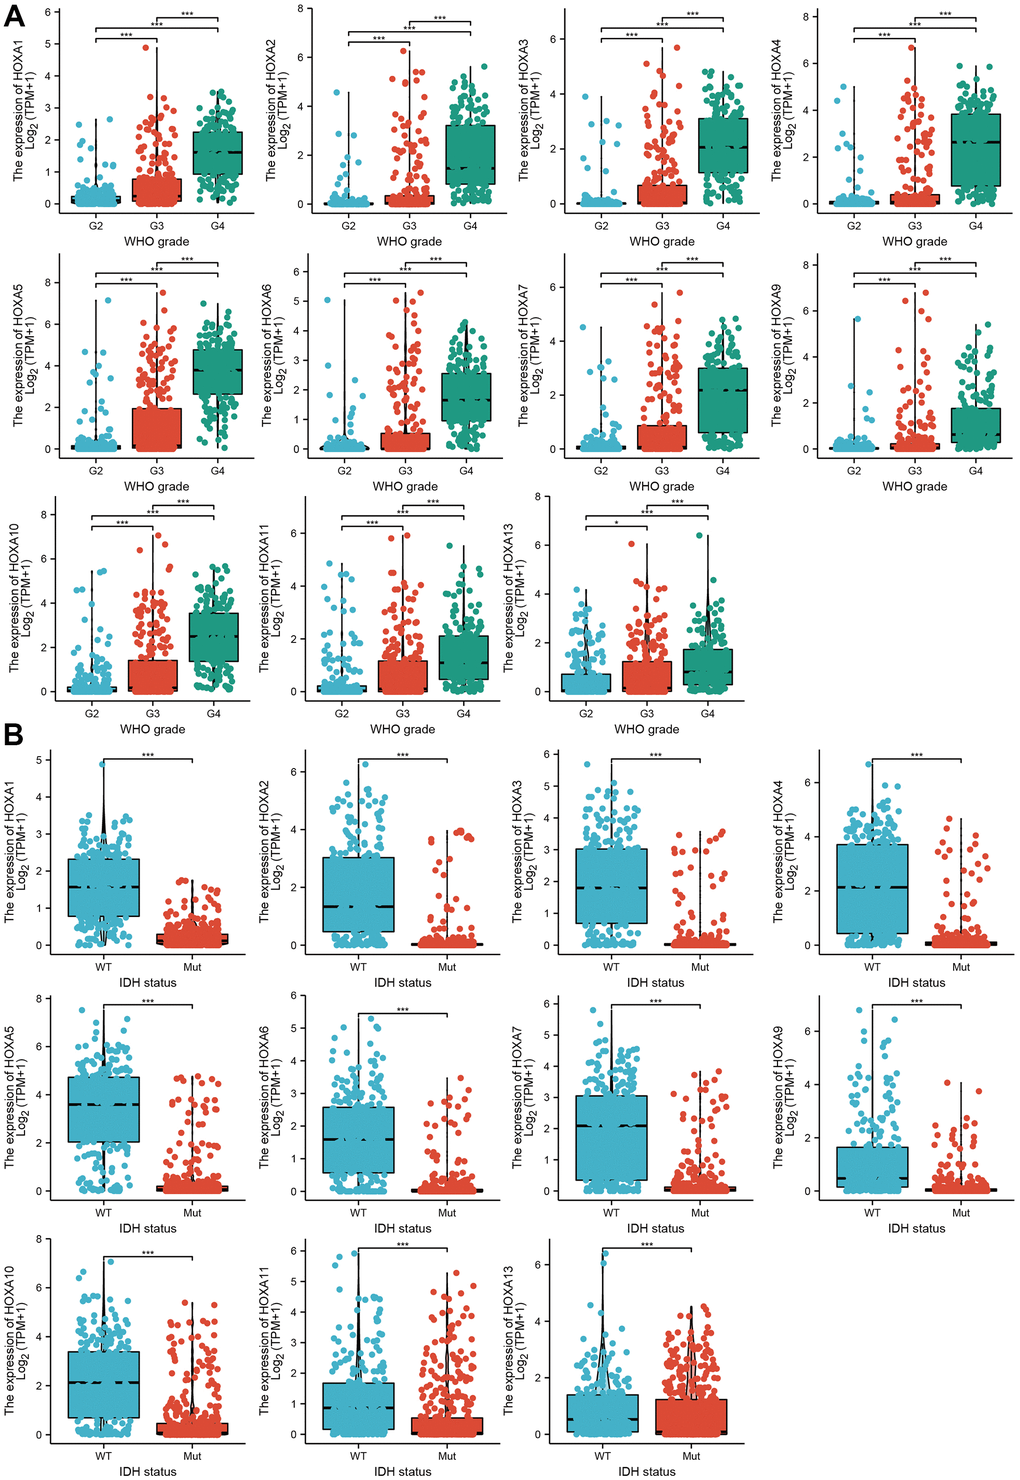
Figure 2.The correlation between HOXAs expression and clinical information in LGG. (A, B) The correlation between HOXAs expression and clinical features, including the higher tumor grades and IDH mutation status in glioma based on TCGA-LGG. *p < 0.05, **p < 0.01, ***p < 0.001.