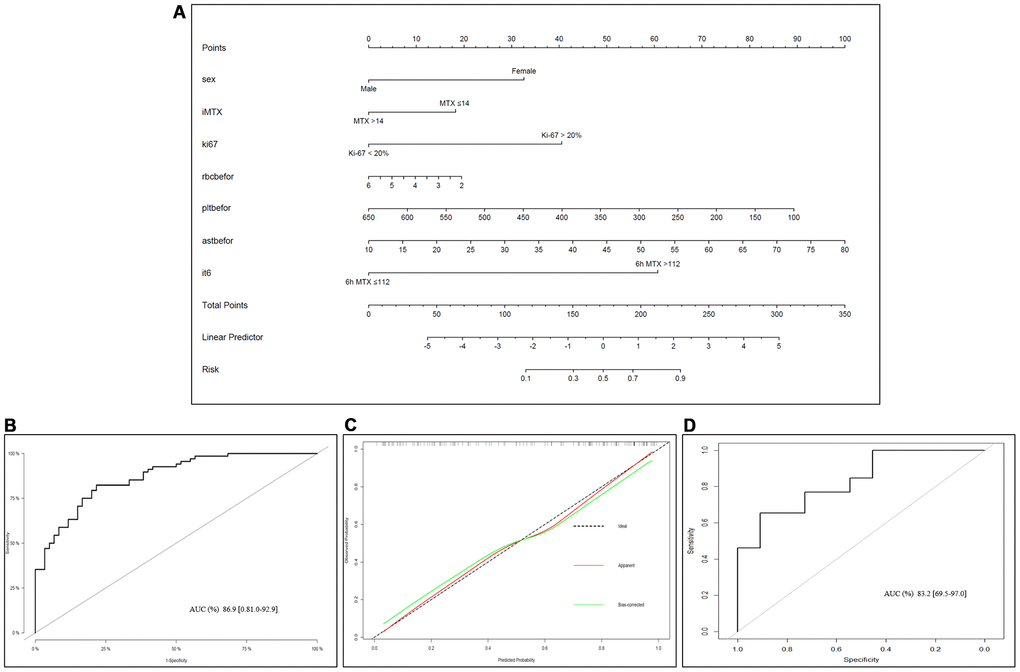
Figure 4.Nomogram of LP prediction after MTX chemotherapy in OS. (A) Nomogram model for predicting the occurrence of LP. The clinical and pathological characteristics of the patients were placed on the axis with the variables in the nomogram. The score for each variable was marked. By calculating the sum of these values and marking them on the total score line, the probability of LP in OS patients after receiving MTX treatment was obtained. (B) An ROC curve was used to evaluate the sensitivity and specificity of the nomogram in predicting the occurrence of LP after MTX treatment (the AUC was 86.9%, the specificity was 81.0%, and the sensitivity was 92.9%). (C) Evaluation of the calibration curves for the nomogram for predicting the occurrence of LP after MTX treatment. The calibration curve indicated that the predicted LP values of the nomogram were in good agreement with the observed results; the x-axis represents the predicted probability of LP, and the y-axis represents the actual probability of LP. The black dashed line represents the perfect prediction probability of the ideal model, the red solid line represents the nomogram prediction plot, and the green solid line represents the corrected bootstrap. An accurately calibrated nomogram curve is close to an ideal 45° straight line. (D) ROC curve in the external validation cohort.