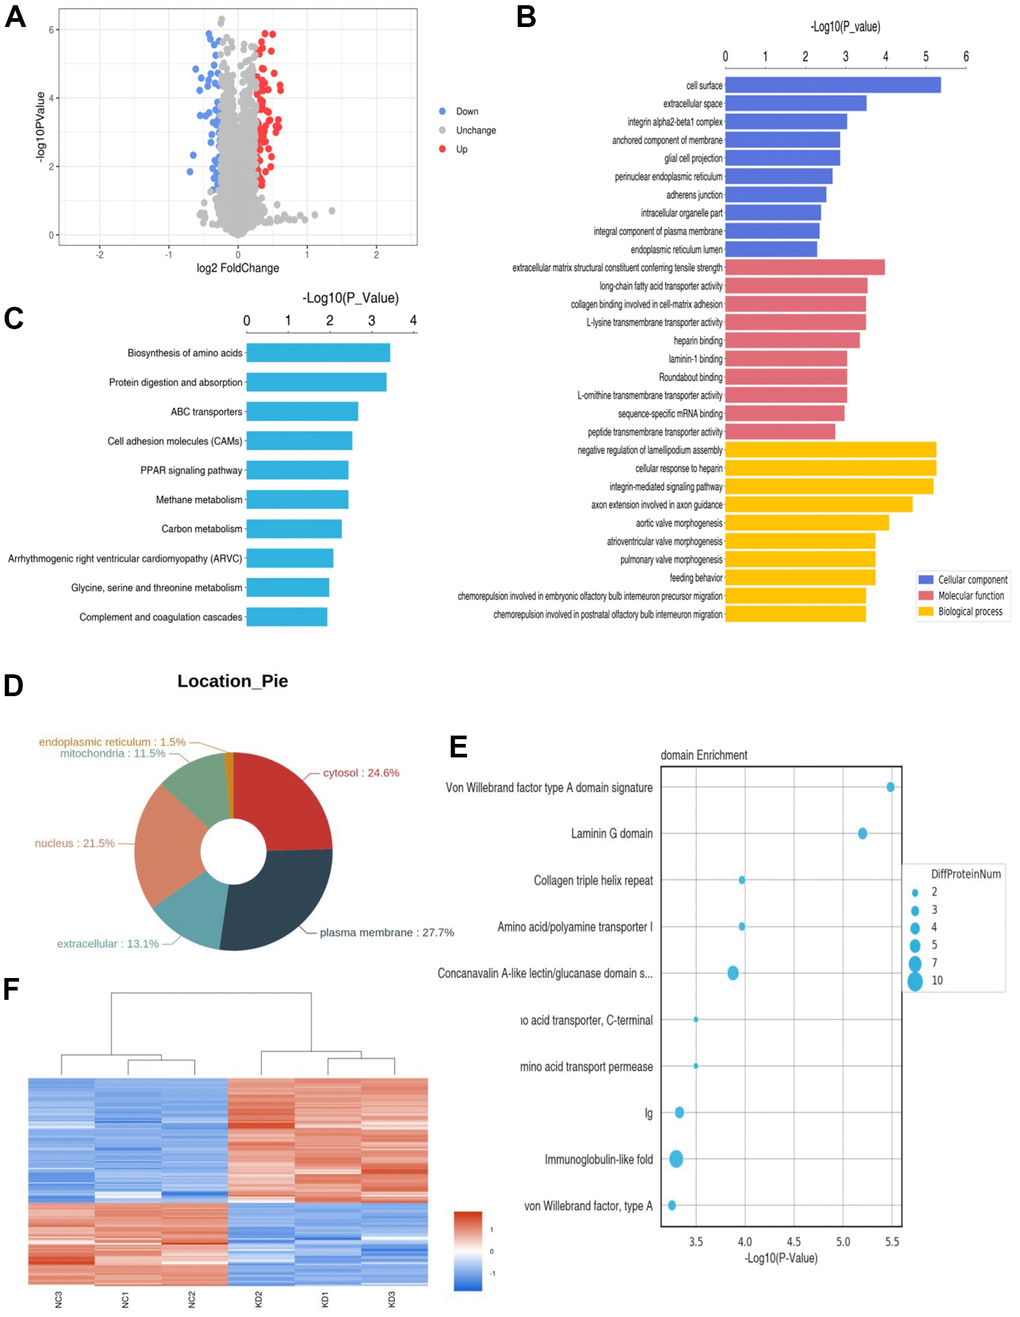
Figure 3.Proteomic results. (A) Differential protein volcano map. The blue circles on the left represent down-regulated proteins and the red circles on the right represent up-regulated proteins. The abscissa is the fold change; The y-coordinate is P value. (B) The bar chart shows the results of the top 10 GO terms with the most significant enrichment. The ordinate represents the GO function name, and the abscissa represents the P-value of enrichment significance. Blue bars represent cellular components, red bars represent molecular functions, and yellow bars represent biological processes. (C) The bar chart identifies the top 10 KEGG pathways with the most significant enrichment. The ordinate is KEGG pathway name and the abscissa is p-value. (D) Protein subcellular localization map. (E) The top 10 protein domains with the most significant enrichment are shown in the bubble diagram. The ordinate is the name of the structure domain, and the abscissa is the p-value. The size of the circle represents how many differential proteins are contained in the domain. (F) Red represents up-regulated proteins and blue represents down-regulated proteins.