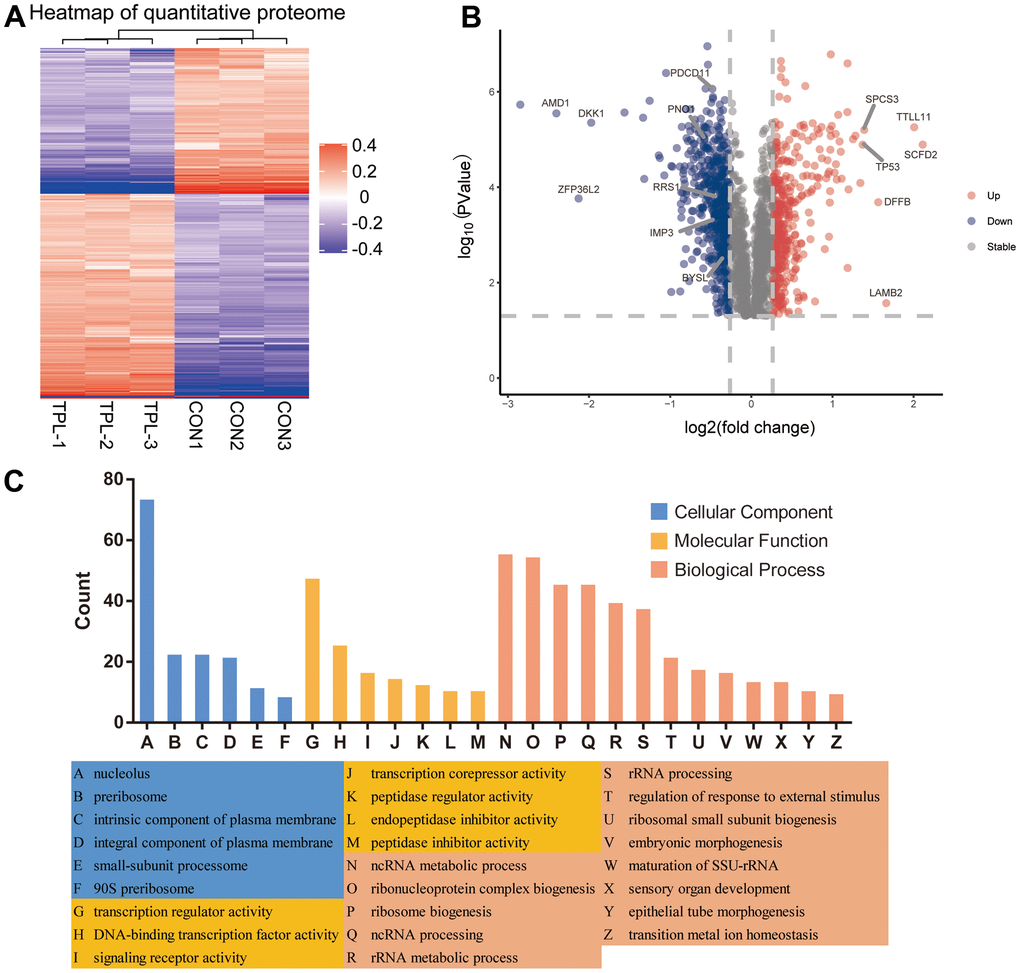
Figure 2.Differential expression levels of the quantitative proteome and their enrichment in Gene Ontology terms. (A) Heatmap of the quantitative proteome based on fold differences in expression. (B) Volcano plot of the differences in protein levels. The volcano map was drawn based on the expression of FC and P value (T-test). The significantly down-regulated proteins were blue (FC< 0.83 and P <0.05), the significantly up-regulated proteins were red (FC>1.2 and P <0.05), and the proteins with no difference were gray. (C) Classification of differentially expressed proteins based on Gene Ontology biological processes, cellular components and molecular functions.