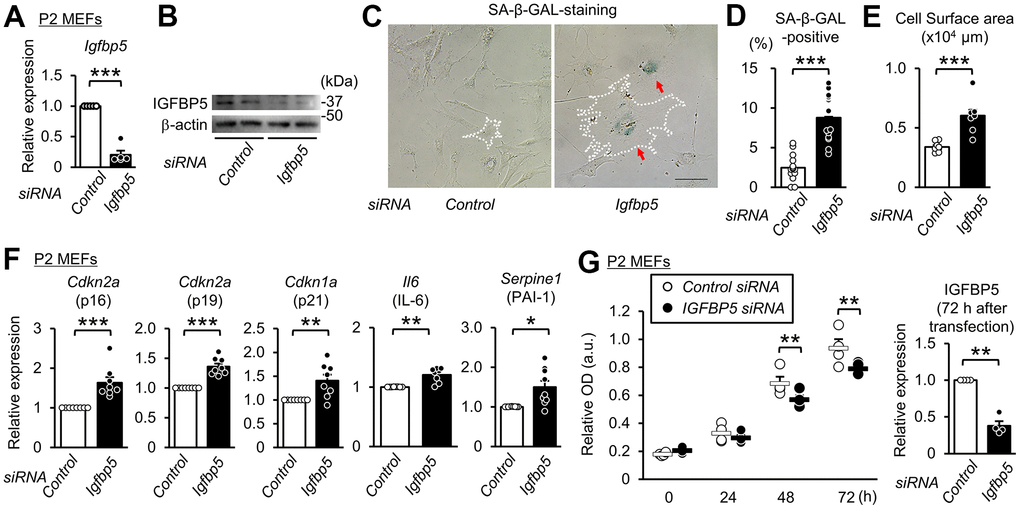
Figure 2.Knockdown of IGFBP5 induces premature senescence in young MEFs. (A) Levels of Igfbp5 mRNA in P2 MEFs 48 h after transfection with control siRNA and siRNA against Igfbp5. N=5 in each treatment. ***P<0.001 by paired Student’s t-test. (B) Representative immunoblot for IGFBP5 in P2 MEFs transfected with control siRNA and siRNA against Igfbp5. kDa: kilodalton. (C) Representative images of SA-β-GAL staining in cells transfected with control siRNA or Igfbp5 siRNA. A white dotted line in each field was added to visualize the representative outline of the cell. Red arrows indicate cells positive for SA-β-GAL staining. Scale bar, 100 μm. (D) Summary data of the percentage of SA-β-GAL-positive cells. N=14 from two independent experiments in each treatment. ***P<0.001 by unpaired Student’s t-test. (E) Summary data of cell surface areas. N=8 from two independent experiments. ***P<0.001 by unpaired Student’s t-test. (F) Levels of Cdkn2a (p16 and p19), Cdkn1a (p21), Il6 and Serpine1 (PAI-1) mRNA in P2 MEFs transfected with control siRNA or siRNA against Igfbp5. N=8-9 in each treatment. *P<0.05, **P<0.01, ***P<0.001 by paired Student’s t-test. (G) (Left) Cell proliferation in P2 MEFs transfected with control siRNA and siRNA against Igfbp5 determined by Cell Counting Kit-8. N=4 in each treatment. **P<0.01 by two-way repeated measures ANOVA with a Student-Newman-Keuls test. (Right) Level of Igfbp5 mRNA 72 h after transfection. **P<0.01 by paired Student’s t-test. Data are represented as mean +/- SEM.