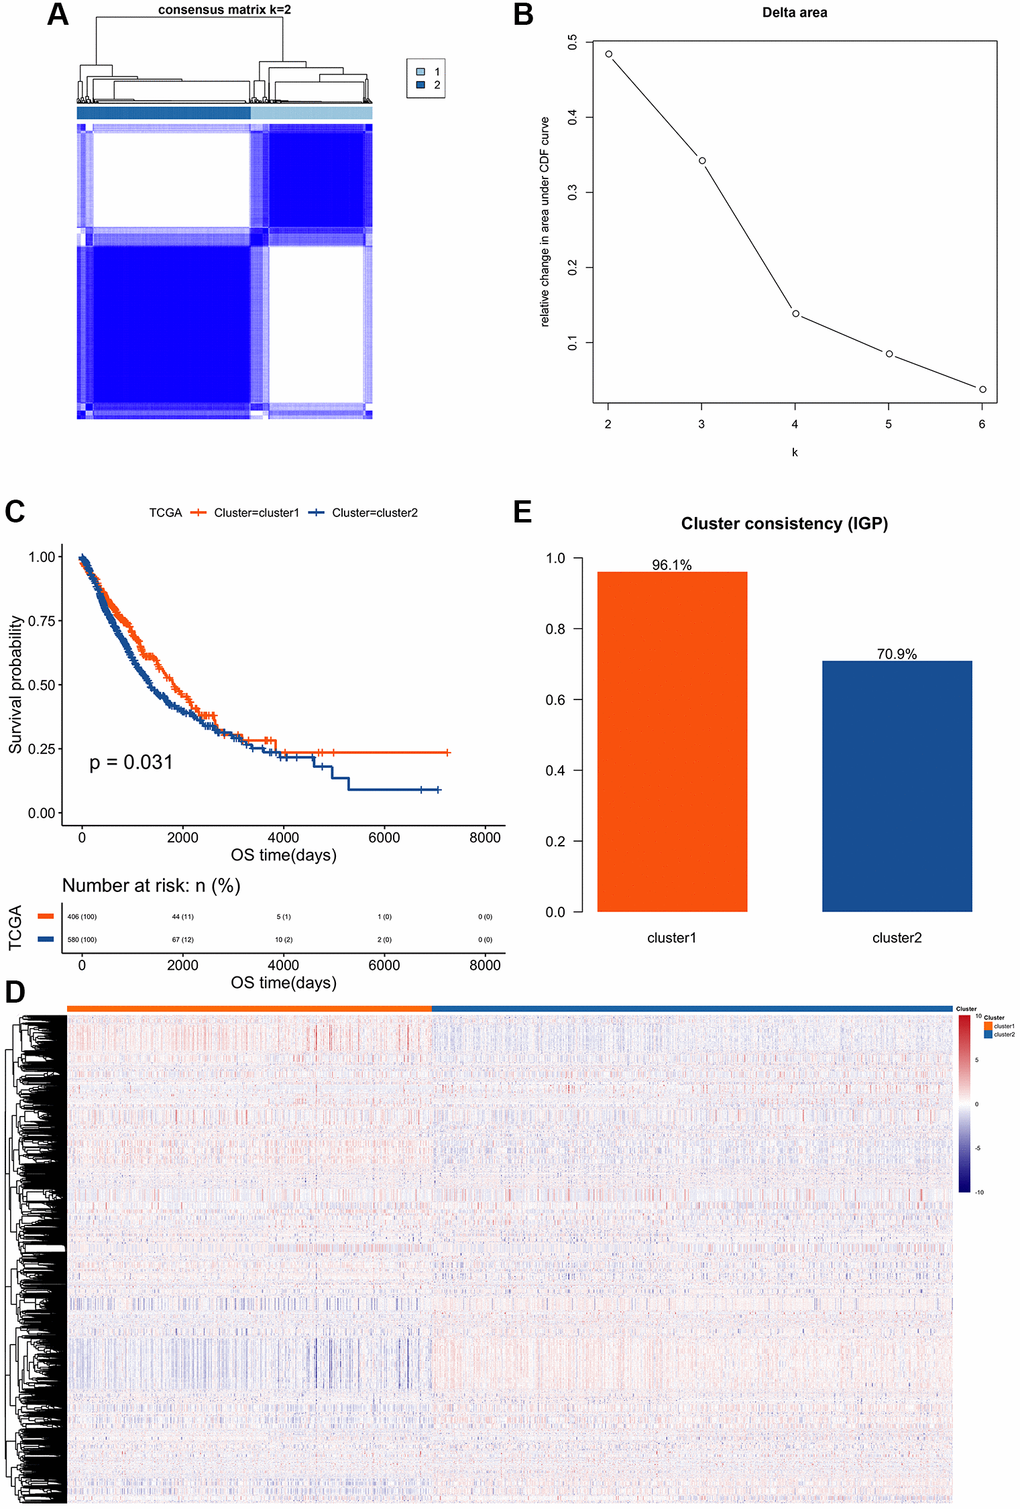
Figure 1.Clustering and survival analysis of feature edge perturbation matrix. (A) Based on the extracted 5468 feature edges, a consistent cluster analysis was performed according to their feature values, and 986 cancer samples were divided into two different subtypes. (B) Cumulative Distribution Function of Consistent Cluster Analysis. The abscissa axis represents the K value; the ordinate axis represents the relative change in area under CDF curve. (C) The prognostic survival curves of the two cluster subtypes. The abscissa axis represents the overall survival time; the ordinate axis represents the survival probability corresponding to different survival time points. (D) Z-score heatmap of eigenvalues of feature edges: Using hierarchical clustering method to perform cluster analyses on the extracted feature values, it is found that there are obvious specific feature differences between the two subtypes. (E) Validation of clustering performance of gene interaction perturbation: Using an independent data set (GSE50081) to verify the clustering performance of edge perturbation features. The larger IGP corresponds to the better consistency of the clustering group.