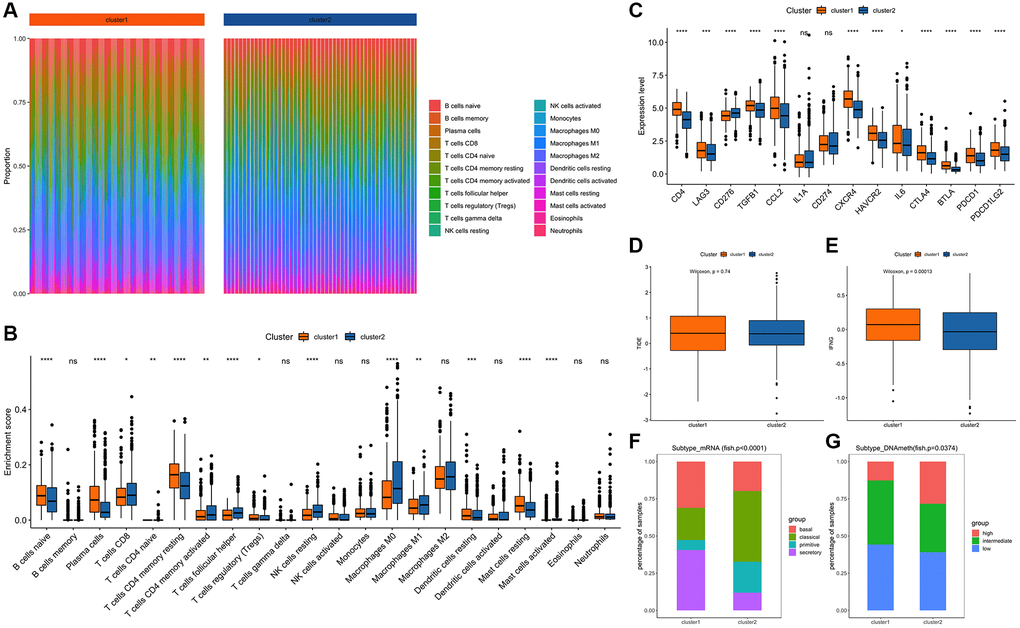
Figure 2.Comparison and analysis of feature subtypes of edge perturbation. (A) Infiltration scores of 22 immune cells in different samples: Different colors represent different immune infiltrating cells. The abscissa axis represents different samples; the ordinate axis represents the proportion of different immune cells. (B) Comparison of the differences of 22 immune cell infiltration scores among different cluster subtypes: The abscissa axis represents different types of immune cells; the ordinate represents the proportion of infiltrated immune cells. (C) Comparison of the expression levels of important immune checkpoint molecules among different cluster subtypes. (D) TIDE comparison between cluster 1 and cluster 2: The abscissa axis represents different clusters; the ordinate axis represents TIDE. (E) IFNG comparison between cluster 1 and cluster 2: The abscissa axis represents different clusters; the ordinate axis represents IFNG. (F) Comparison of mRNA expression levels among different subtypes: The different colors represent the known pathological types of NSCLC. The abscissa axis represents different clusters, and the ordinate axis represents the expression level of mRNA. (G) Comparison of DNA methylation levels among different subtypes: The different colors represent the levels of DNA methylation. The abscissa axis represents different clusters, and the ordinate axis represents the proportion of samples with different levels of DNA methylation.