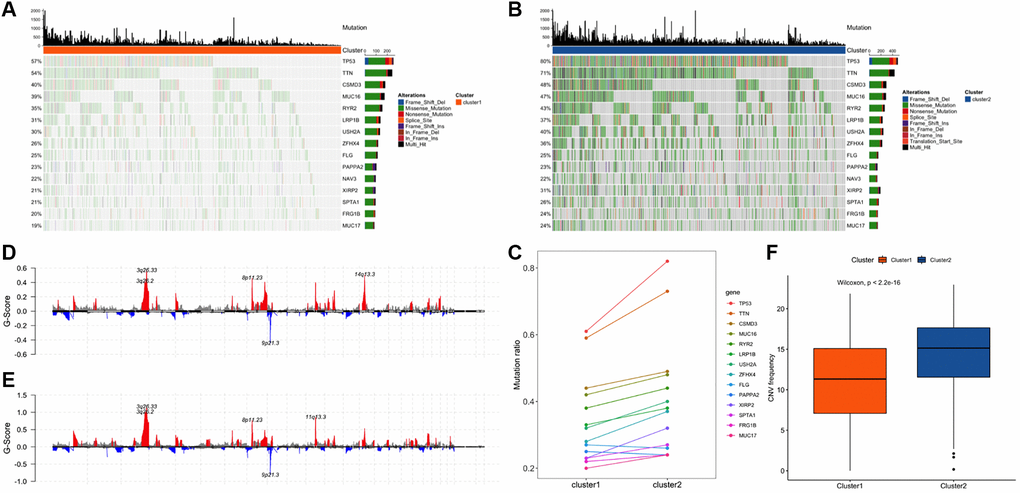
Figure 3.Comparison of genome alterations between cluster 1 and cluster 2. (A) The distribution of 15 mutated genes in cluster 1 among the co-occurring genes with mutation frequencies in the top 20 of the two clusters. (B) The distribution of 15 mutated genes in cluster 2 among the co-occurring genes with mutation frequencies in the top 20 of the two clusters. (C) Comparison of the mutation ratios of 14 genes in the two clusters. (D) Distribution of concentrated copy number amplification and deletion regions in the cluster 1. (E) Distribution of concentrated copy number amplification and deletion regions in the cluster 2. (F) Frequency distribution of copy number variation among subtype samples.