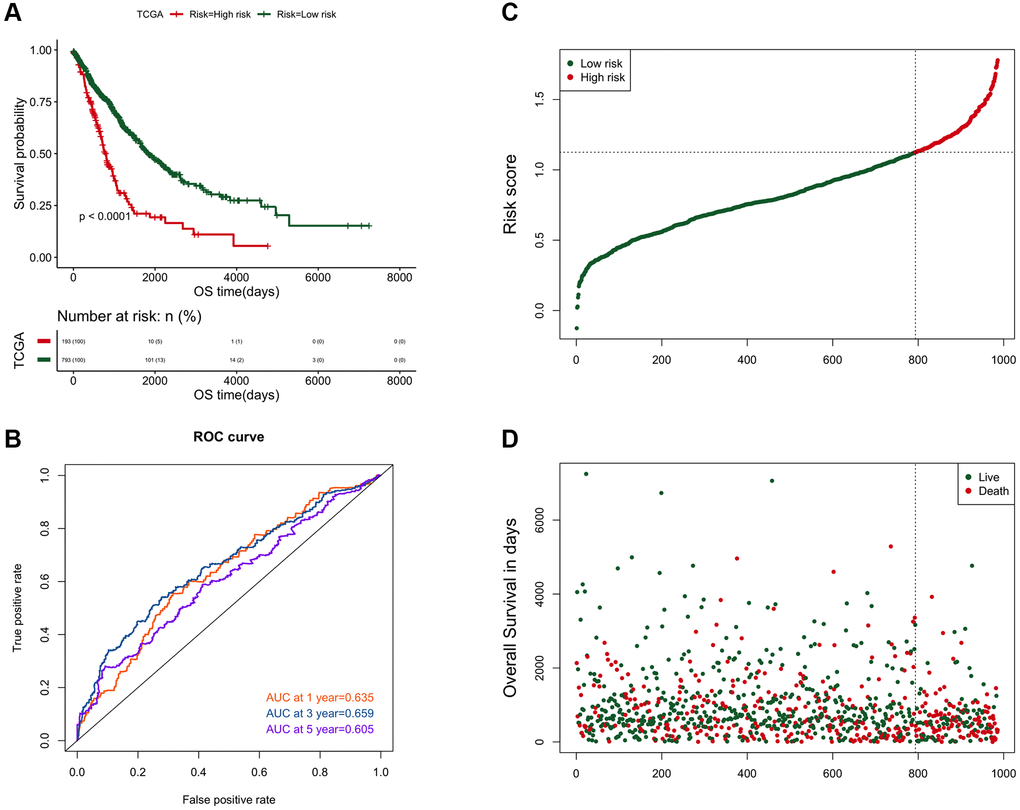
Figure 5.The efficiency analysis results of the risk prediction model. (A) Comparison of the prognosis between high and low risk groups. The abscissa axis represents the survival time (days); the ordinate axis represents the survival probability. (B) AUC curve of risk score on 1, 3, and 5-year survival prediction efficiency. (C) Risk score curve of the two groups. The abscissa axis represents the number of samples; the ordinate axis represents the risk score. (D) The ranking results of risk scores from small to large. The abscissa represents the number of samples, and the ordinate represents the survival time.