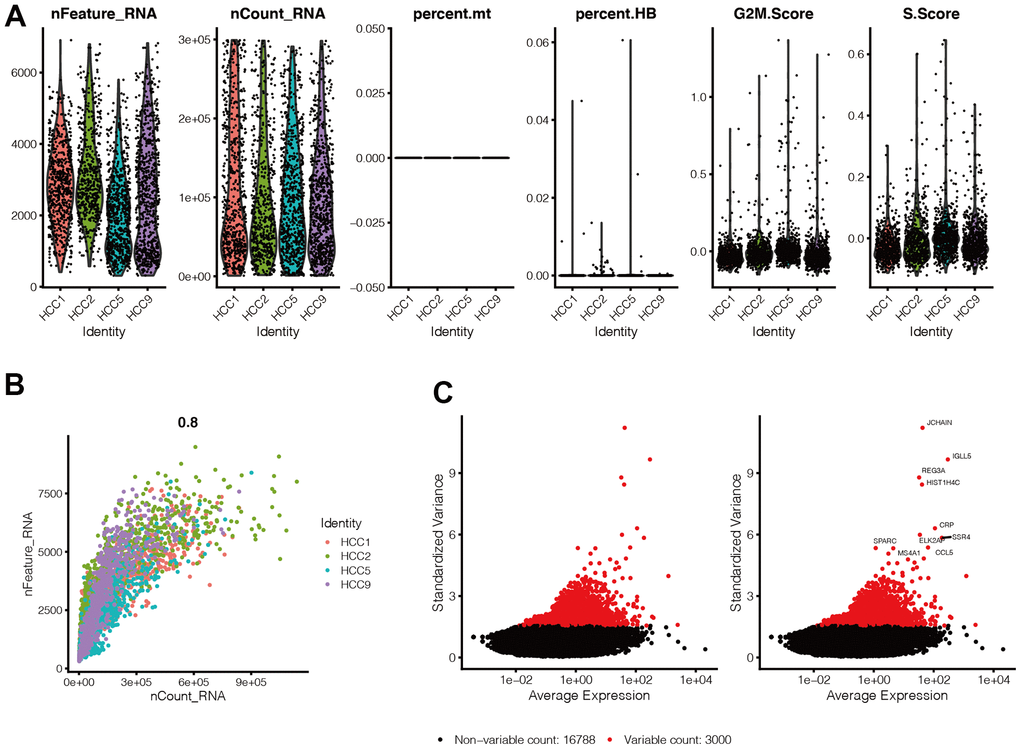
Figure 1.Quality control of single-cell sequencing data. (A) Gene expression levels in each cell of the 4 samples were in the range of 300-7000, and the distribution was relatively uniform. At the same time, we found that the percentage of mitochondrial genes was almost 0, and the percentage of red blood cell genes was less than 1, and the scores of G2M phase and S phase of the cell cycle were evenly distributed in the four samples. (B) Cells are evenly distributed in the four samples, and the number of genes is positively correlated with the expression level of genes, with a correlation of 0.8. (C) We selected 300 hypervariable genes from all the genes, which are in red, and the first 10 genes were flagged.