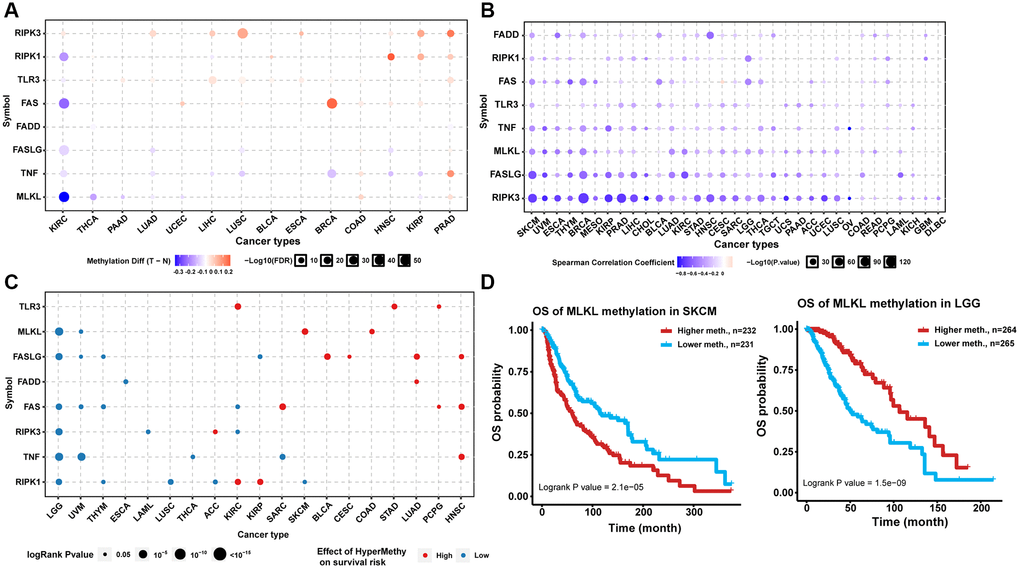
Figure 2.Methylation analysis of necroptosis-related regulators. (A) Differential methylation status of necroptosis-related regulators between normal and tumor tissues in different cancers. The red bubble and blue bubble represent hypermethylation and hypomethylation in tumors, respectively. The bubble size is positively correlated with the FDR significance, and the bubble was filtered by FDR significance (FDR ≤ 0.05). (B) Correlation between methylation level and mRNA expression. The blue bubble and red bubble represent negative and positive correlations, respectively. The bubble size is positively correlated with the significance of FDR. (C) Methylation survival analysis of necroptosis-related regulators in different cancers. The bubble color from blue to red represents the hazard ratio from low to high, and the bubble size is positively correlated with the Cox P-value significance. (D) Kaplan-Meier curves between high and low methylation groups of MLKL in SKCM and LGG.