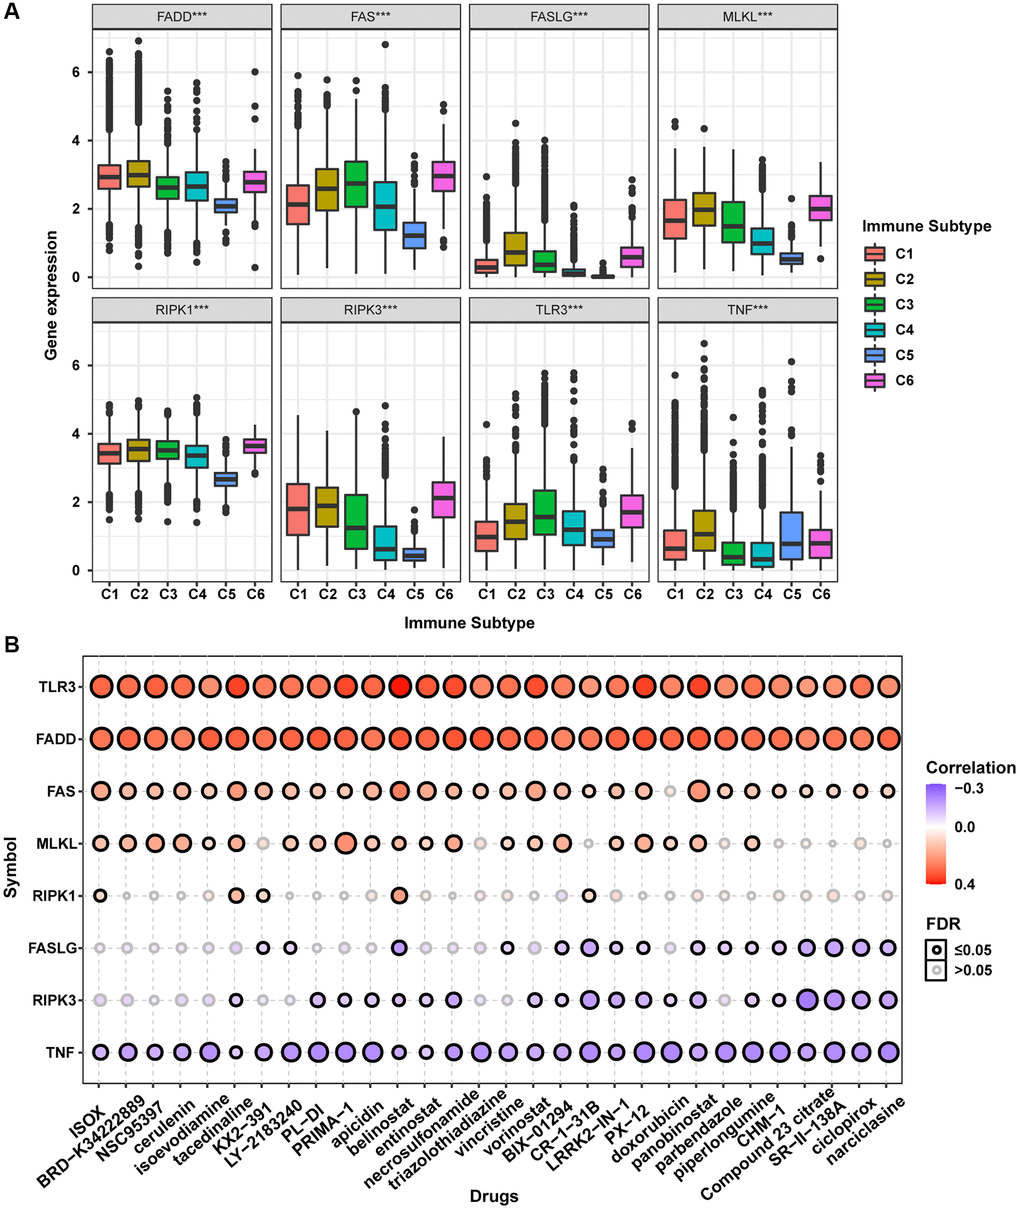
Figure 7.Immune subtype and drug sensitivity analysis of necroptosis-related regulators. (A) Expression differences of necroptosis-related regulators between six pan-cancer immune subtypes. (B) Bubble plot showing the correlation between drug sensitivity (IC50) and gene expression level of necroptosis-related regulators in CTRP database. Positive correlation (red bubble) indicates one gene with high expression was resistant to a drug, while negative correlation (blue bubble) indicates one gene with high expression was sensitive to a drug. The color depth and size of bubble are positively correlated with the correlation coefficient and the FDR significance, respectively. Black outline border indicates FDR ≤ 0.05.