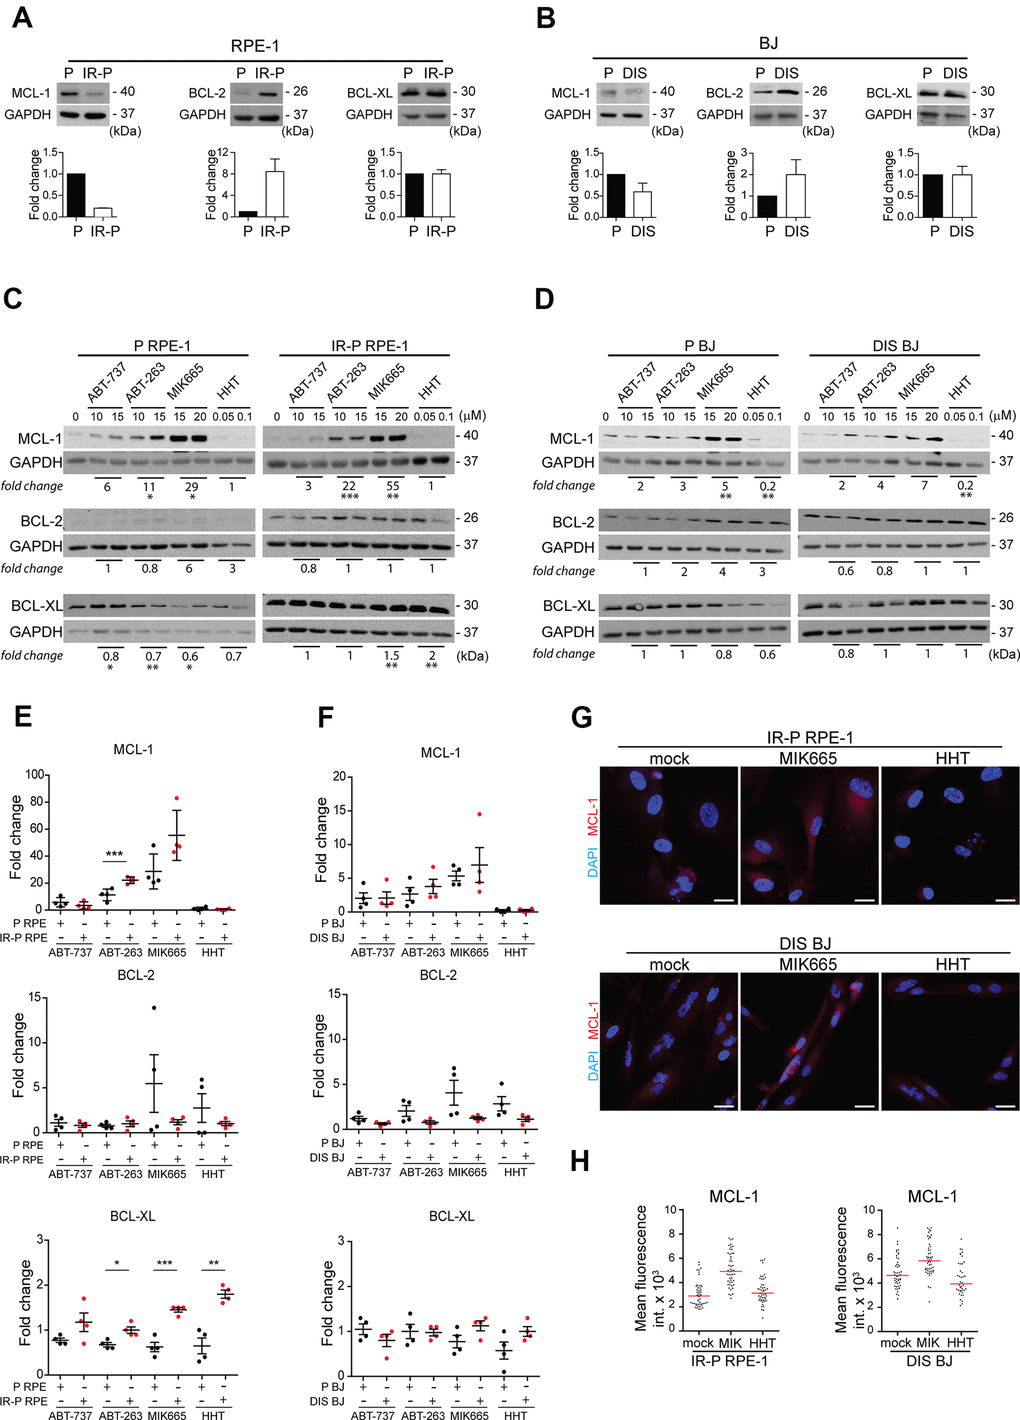
Figure 5.Analysis of the expression levels of the anti-apoptotic proteins in the cell populations resistant to ABT-263, ABT-737, MIK665, and HHT. Immunoblotting analysis of MCL-1, BCL-2, and BCL-XL anti-apoptotic protein levels in proliferating (P) and senescent cells induced by (A) IR (IR-P RPE) or (B) docetaxel (DIS BJ). The difference between the levels detected in P and IR-P or DIS cells is expressed as fold-change. Three independent experiments were analyzed. Immunoblotting analysis of MCL-1, BCL-2, and BCL-XL anti-apoptotic protein levels in (C) RPE-1 (P and IR-P) and (D) BJ (P and DIS) after 24-h long exposure to ABT-263, ABT-737, MIK665, and HHT. The difference between the untreated control and the 'resistant' population was expressed as the mean of fold change obtained for two concentrations in two independent experiments. (E, F) Quantitative analysis of immunoblots (presented in C and D) comparing the fold-change of anti-apoptotic protein levels in treatment-surviving populations between proliferating and senescent cells. The mean ± SD is shown. All statistical analyses were carried out using the two-tailed Student's t-test; *, P > 0.05; **, P < 0.01; ***, P < 0.001. (G) Indirect immunofluorescence staining for MCL-1 levels (red signal) in senescent IR-RPE-1 and DIS-BJ cells after treatment with MIK665 (15 μM) and HHT (100 nM). Cell nuclei were stained by DAPI (blue signal). (H) Quantitative analysis of MCL-1 levels in individual cells (presented in G), expressed as a mean fluorescence intensity in cytoplasm of individual cells (n > 40). Two different regions of each individual cell were analyzed and their mean plotted. Note the heterogeneous MCL-1 expression represented as a variance of fluorescence signal. Bar, 30 μm.