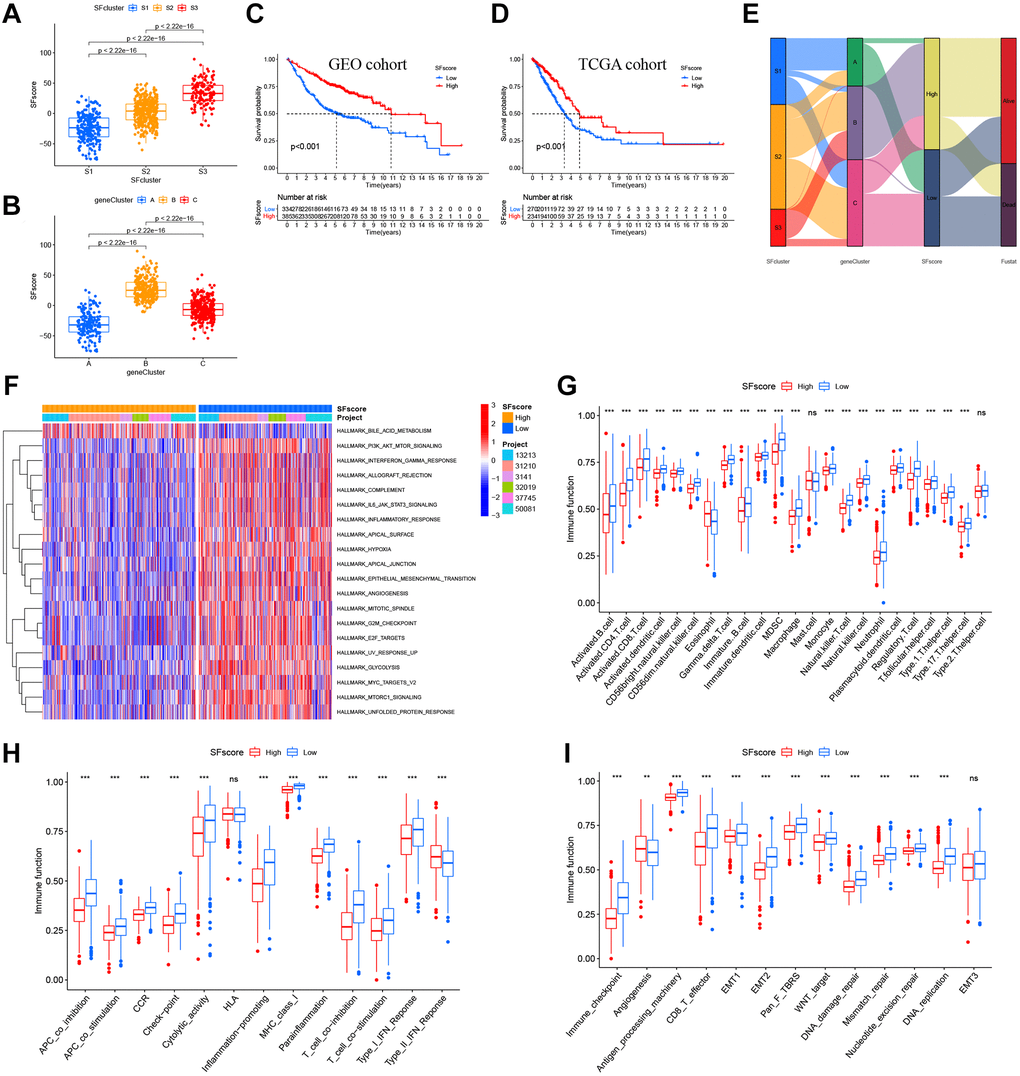
Figure 7.Characteristics of SFscore in prognosis and TME landscapes. (A) Differences in the SFscore between three SF clusters in LUAD (P < 2.22e-16). (B) Differences in the SFscore between two gene clusters in LUAD (P < 2.22e-16). (C) Kaplan-Meier curves for low and high SFscore patient groups in GEO cohorts (P < 0.001, Log-rank test). (D) Kaplan-Meier curves for low and high SFscore patient groups were validated in TCGA cohorts (P < 0.001, Log-rank test). (E) Alluvial diagram showing the changes of survival status, SFs clusters, gene clusters and SFscore. (F) GSVA enrichment analyses between groups with low/high SFscore. (G) TME cell infiltrating abundances in low/high SFscore groups. (H) Difference of immune functions in low/high SFscore groups. (I) Difference of other tumor-related biological processes in low/high SFscore groups.