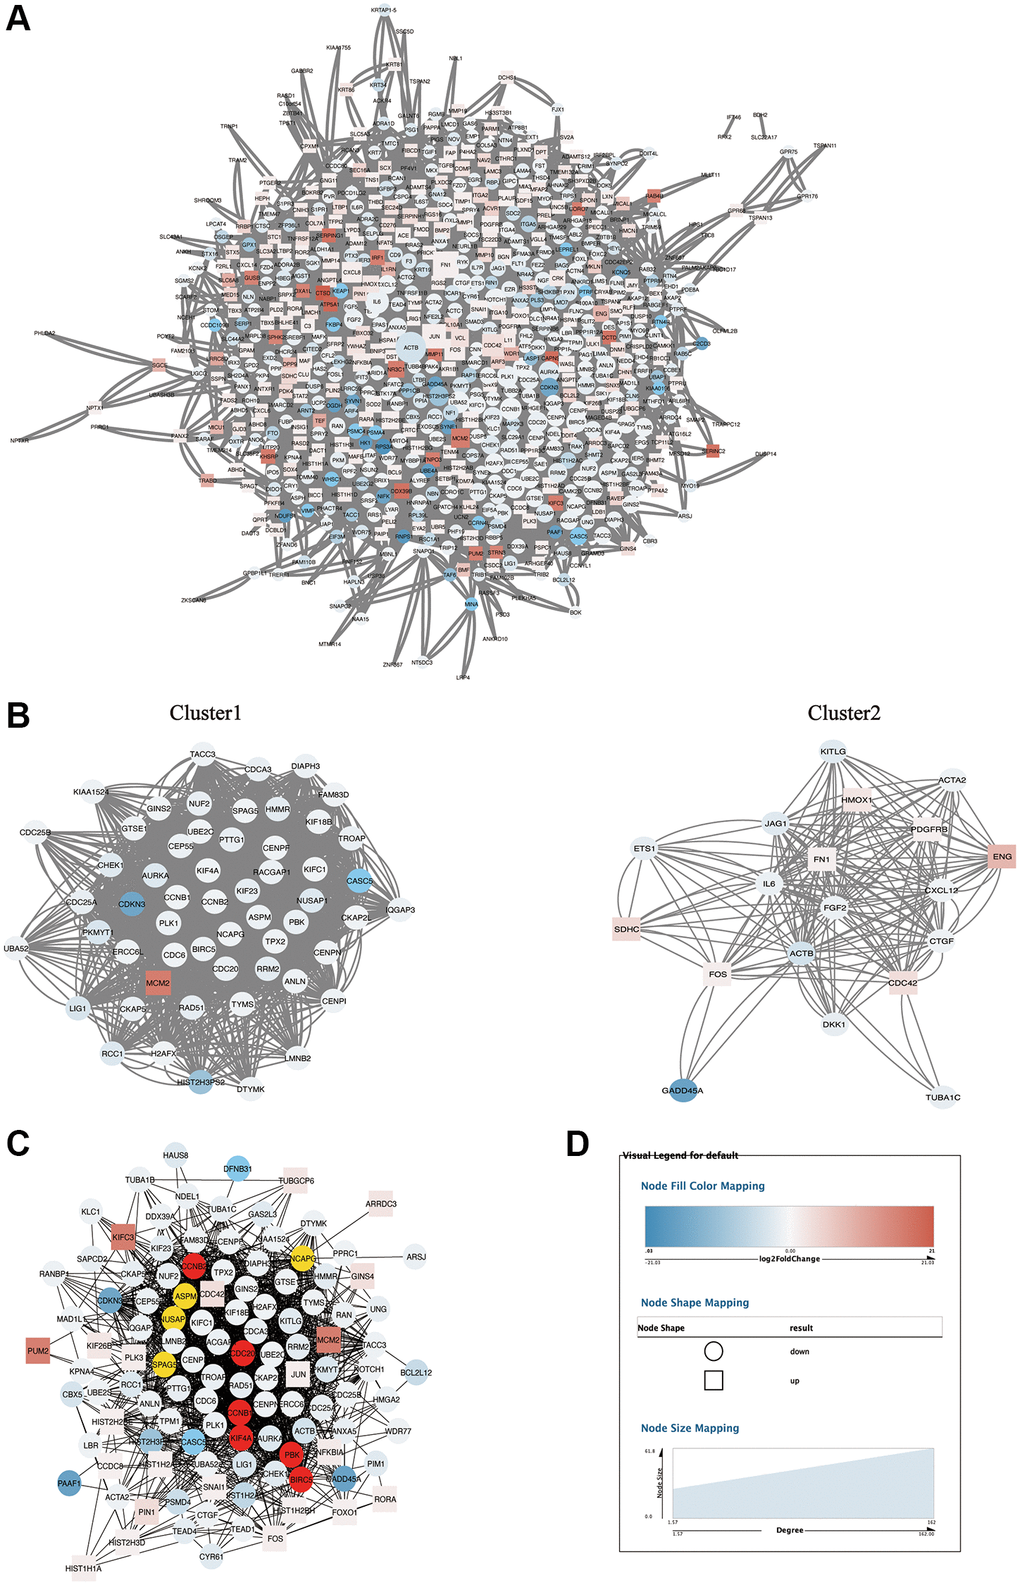
Figure 5.PPI network analysis of DEGs. (A) The PPI network of 698 DEGs. (B) Cluster1 and cluster 2 sub-networks obtained after MCODE analysis of PPI network. (C) MCC sub-network obtained after CytoHubba analysis of PPI network. (D) The legend of networks. The round represents down-regulated DEGs, the square represents up-regulated DEGs, and the size of the node graph represents the degree for (A), which denotes the number of nodes connected to each node. The colors of the nodes indicate the size of log2 (fold change). The higher and lower the expression is, the redder and bluer it is, respectively.