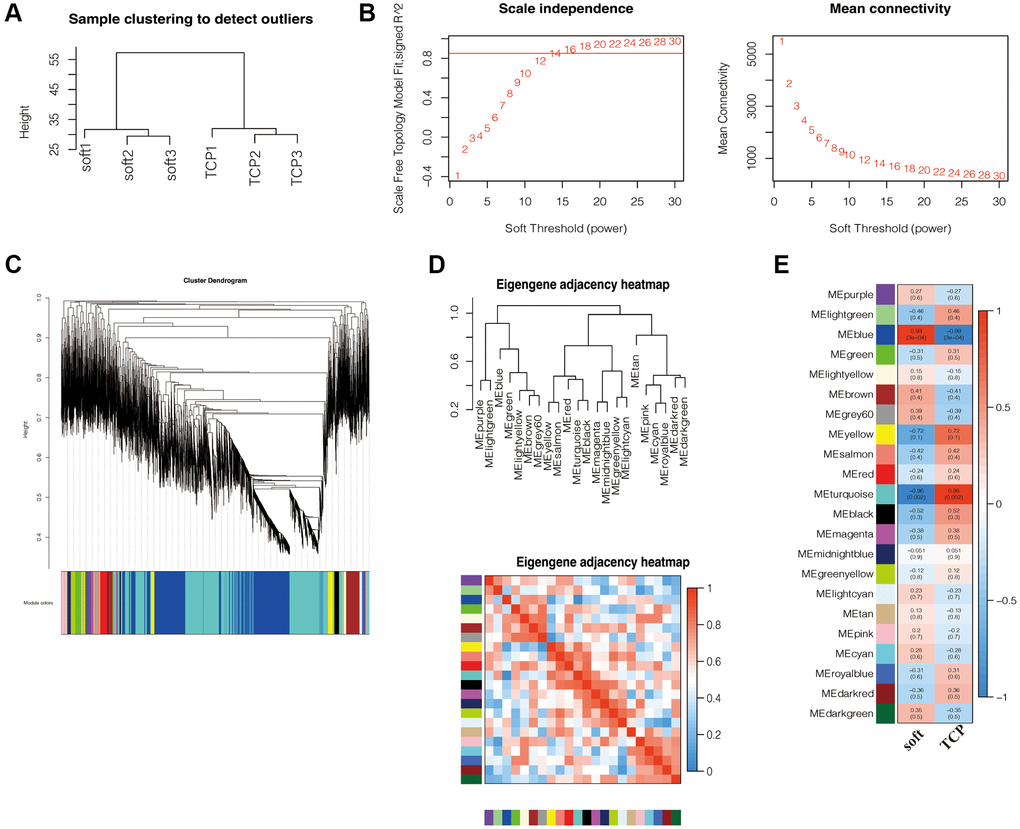
Figure 6.WGCNA and significant module recognition. (A) Sample clustering found no obvious outliers. (B) Analysis of network topology for various soft-thresholding powers. The left panel shows the scale-free fit index (y-axis) as a function of the soft-thresholding power (x-axis). Power 14 was chosen because the fit index curve flattened out upon reaching a high value (> 0.85). The right panel displays the mean connectivity (degree, y-axis) as a function of the soft-thresholding power (x-axis). (C) Clustering dendrogram of all mRNAs dataset based on topological overlap. Each module is given a unique colour and represents a cluster of coexpressed genes. (D) The eigengene adjacency heatmap was used to illustrate the relationship between eigengenes and phenotypic traits. (E) Identification of key modules related to the impact of soft matrices on hFFs. Heatmap displaying the correlations and significant differences between gene modules and samples. Each row corresponds to a module eigengene and each column to a trait. Correlation coefficients and P values are displayed in rectangles. Color-coded by relevance based on a color legend. Blue rectangles represent negative correlations between modules and samples, and red rectangles represent positive correlations between modules and samples.