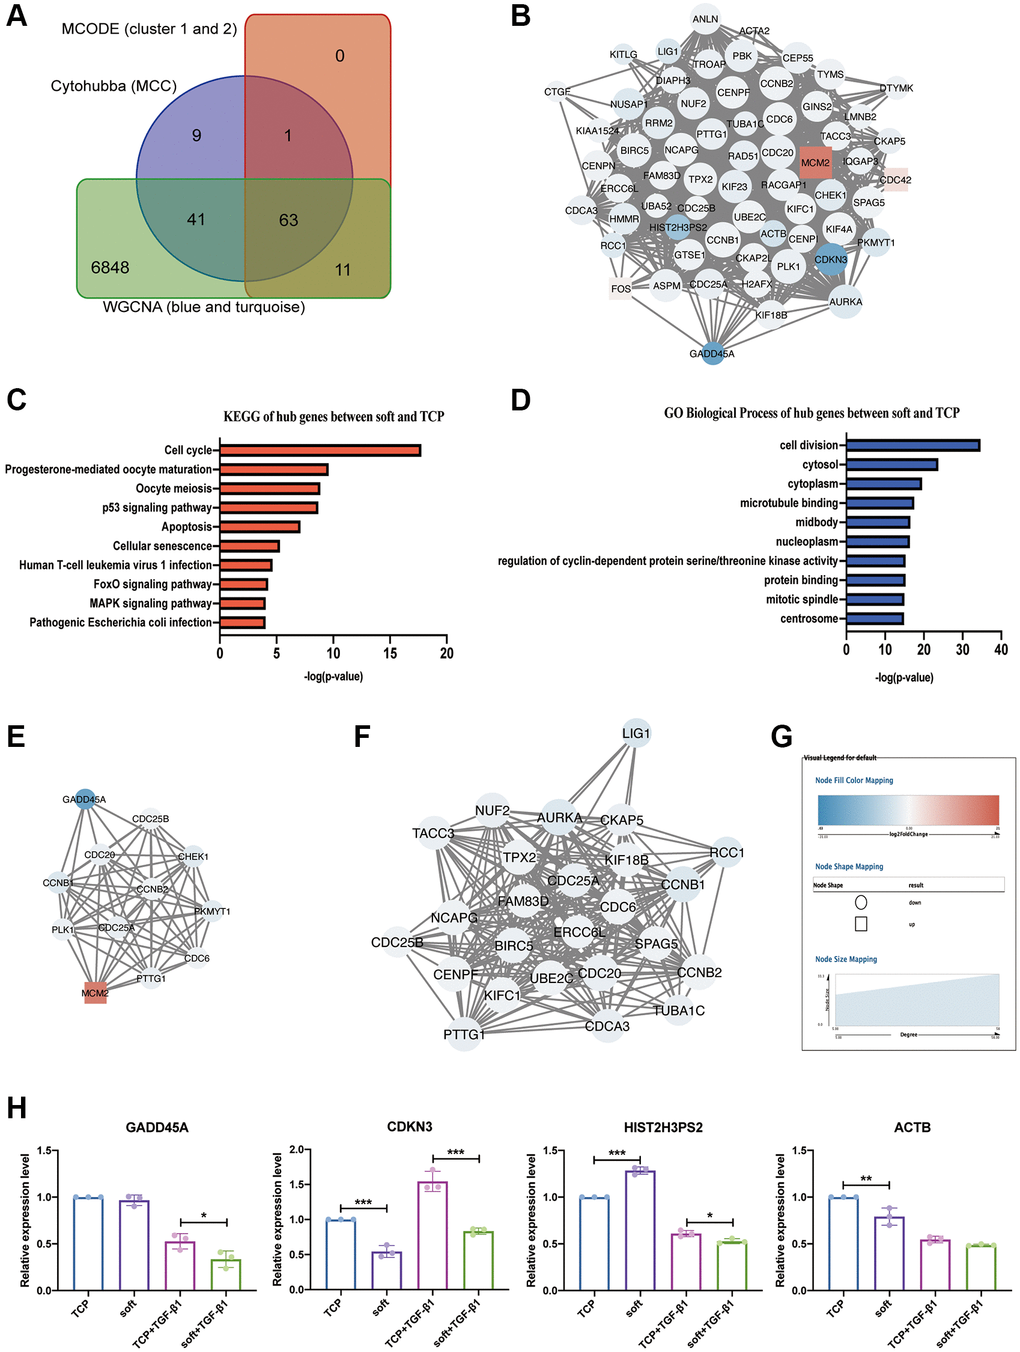
Figure 7.Screening and analysis of hub genes. (A) Veen diagram of CytoHubba (MCC), MCODE (cluster 1 and 2) and WGCNA (blue and turquoise modules). (B) The PPI network of 63 hub DEGs. (C) KEGG analysis of 63 hub DEGs. (D) GO analysis of 63 hub DEGs. (E) The PPI network of 12 hub DEGs in cell cycle. (F) The PPI network of 25 hub DEGs in cell division. (G) The legend of networks. The round represents down-regulated DEGs, the squar represents up-regulated DEGs, and the size of the node graph represents the degree, which denotes the number of nodes connected to each node. The colors of the nodes indicate the size of log2 (fold change). The higher and lower the expression is, the redder and bluer it is, respectively. (H) Quantitative reverse transcription PCR (qRT-PCR) analysis comparing GADD45A, CDKN3, HIST2H3PS2 and ACTB expression levels in soft and TCP with or without TGF-β1. *P < 0.05; **P < 0.01; ***P < 0.001 (mean, n = 3).