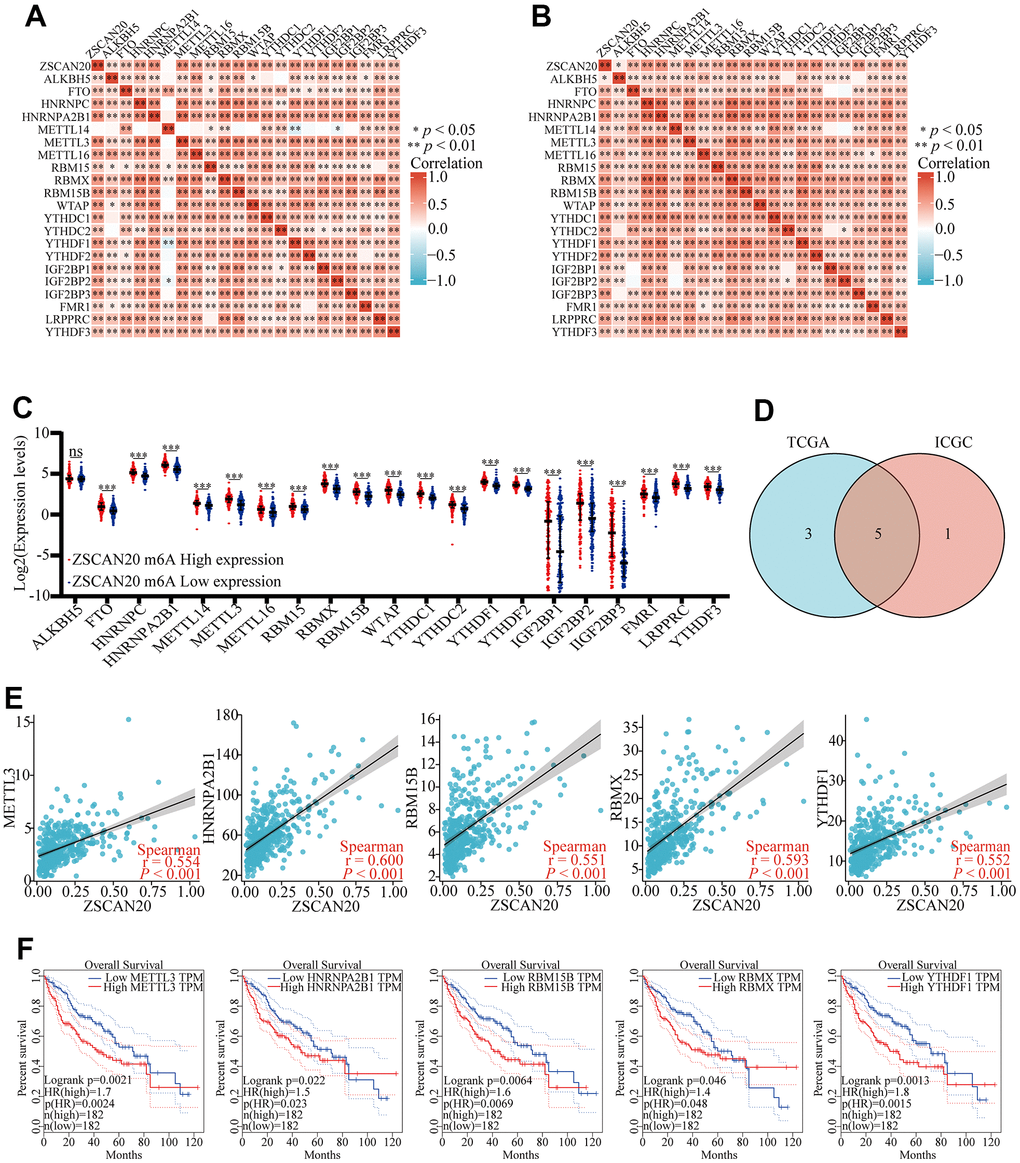
Figure 12.Correlations of ZSCAN20 expression with m6A related genes in HCC. (A, B) TCGA LIHC and ICGC data sets were used to analyze the correlation between the ZSCAN20 and the m6A related genes expression in LIHC. (C) Draw a scatter plot to show the correlation between the ZSCAN20 and the m6A related genes expression, including METTL3, HNRNPA2B1, RBM15B, RBMX and YTHDF1. (D) The differential expression of m6A related genes between high and low ZSCNA20 expression groups in LIHC tumor samples. (E) Venn diagram showed both expression correlation and differential expression of genes. (F) Kaplan-Meier curve of METTL3, HNRNPA2B1, RBM15B, RBMX, YTHDF1. *p < 0.05, **p < 0.01, ***p < 0.001, ****p < 0.0001. ns, not significant.