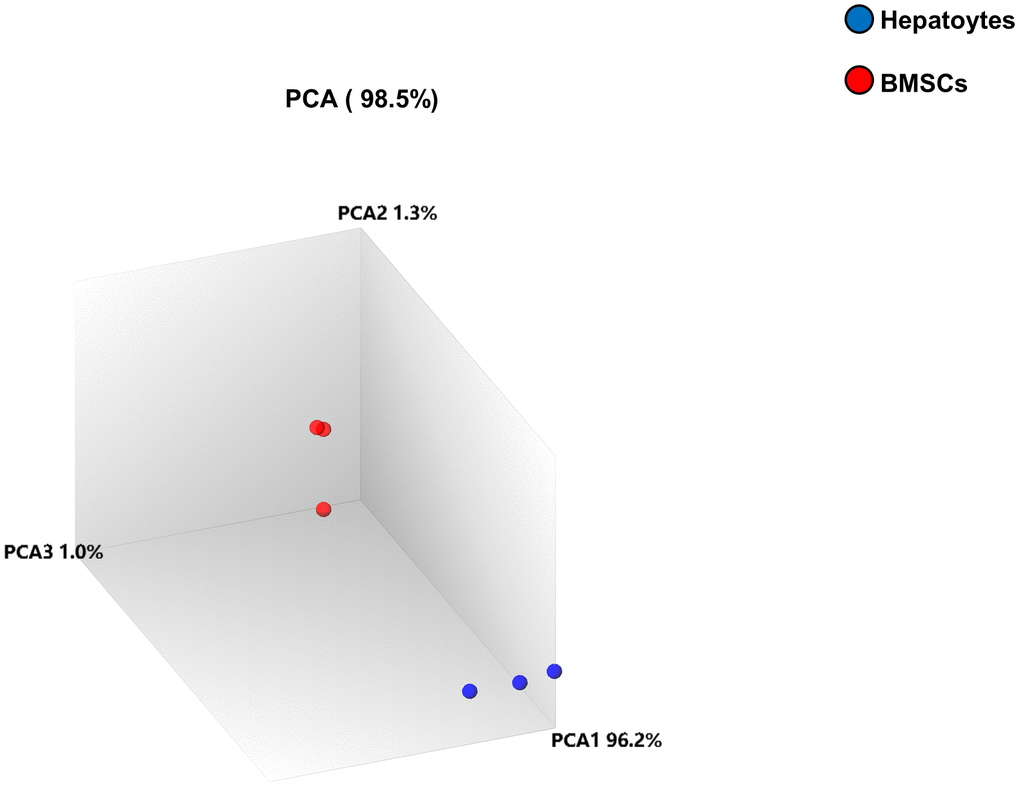
Figure 2.Principal-component analysis (PCA). PCA was performed between the two samples. The differently colored circles indicate the two different samples. The blue and red circles denote the hepatocyte samples and BMSC samples, respectively. The contribution of PCA1, PCA2, and PCA3 to the total mapped difference (98.5%) is 96.2%, 1.3% and 1.0%, respectively.