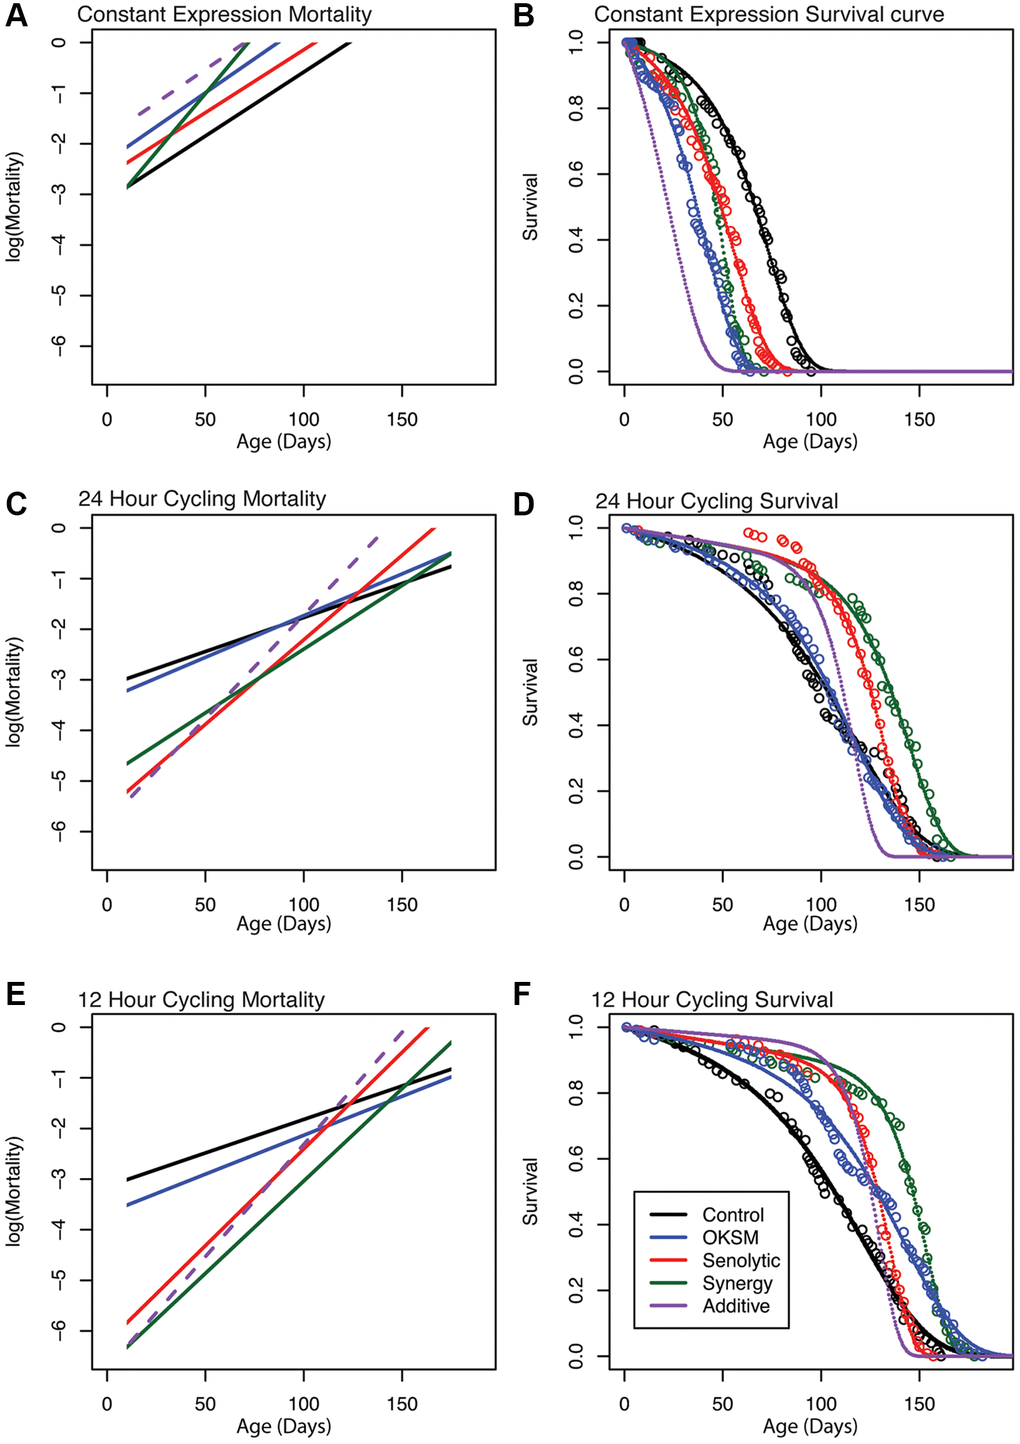
Figure 6.Gompertz–Makeham mortality and survival analysis demonstrates decreased early mortality with compensating increased aging rate in Sen and OKSM interventions. Survival data for each intervention are shown together with the best-fit survival curve on the right and the corresponding mortality trajectories are shown on the left. Initial log(Mortality) parameter (A) can be read as the intersection between mortality curve and y-axis at age zero. The slope of the mortality curve is proportional to 1/MRDT. The dashed purple line illustrates hypothetical mortality trajectory assuming additivity of effects elicited by OKSM and Sen. (A, B) Mortality trajectories and survival curve for cohorts with continuous induction of OKSM, Sen or OKSM+Sen and controls. (C, D) Mortality trajectories and survival curve for cohorts with induction of OKSM, Sen or OKSM+Sen for 24 h every three days and matched controls. (E, F) Mortality trajectories and survival curve for cohorts with induction of OKSM, Sen or OKSM+Sen for 12 h every three days and matched controls. Note that flies subject to continuous induction (Panels A and B) are permanently kept at 25°C and are therefore aging more rapidly than flies cultured at 18°C and induced for only for short periods. The slope of the mortality trajectory of controls in A is therefore approximately two times as larger, compared to that of controls in panels C and E. For exact MRDT and A parameter values and associated confidence intervals see: (Supplementary Table 2).
Figure 6 — Combining stem cell rejuvenation and senescence targeting to synergistically extend lifespan | Aging