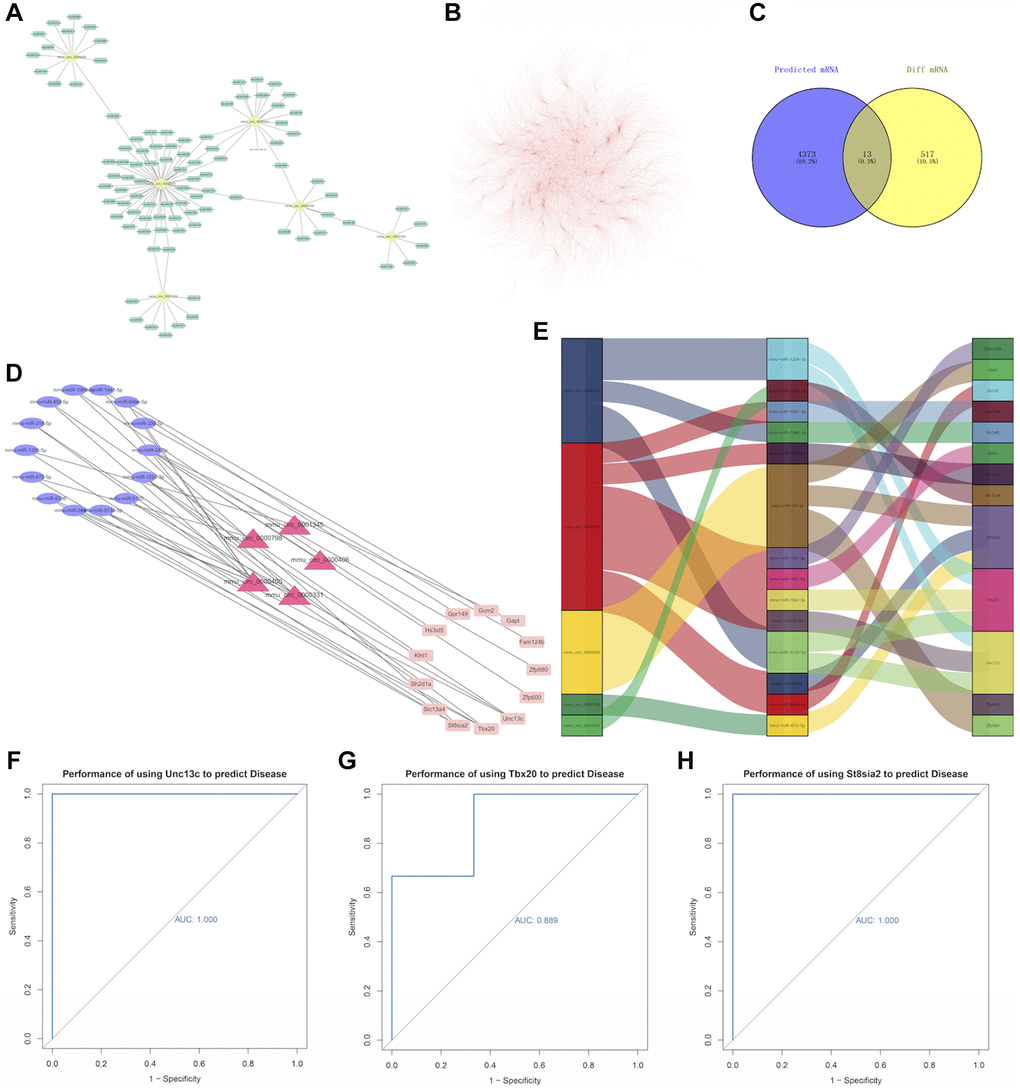
Figure 4.(A) Relationship between circRNA and miRNA. The yellow dots represent circRNAs and the green dots represent miRNAs. (B) miRNA-mRNA relationship pairs. (C) A Venn diagram, in which the purple circle represents 4386 predicted mRNAs, and the yellow circle represents 530 differentially expressed mRNAs in the experiment. Visualization of the ceRNA network. (D) The red triangle in the middle represents circRNA, the blue ellipse on the left represents miRNA, and the pink rectangle on the right represents mRNA. (E) Use the ggalluvial package for mapping, the longer the box, the more pairs of action relationships. (F) ROC curve for Unc13c, (G) ROC curve for Tbx20, and (H) ROC curve for St8sia2. The larger the area under the curve, the higher the AUC value and the better the prediction efficiency of disease.