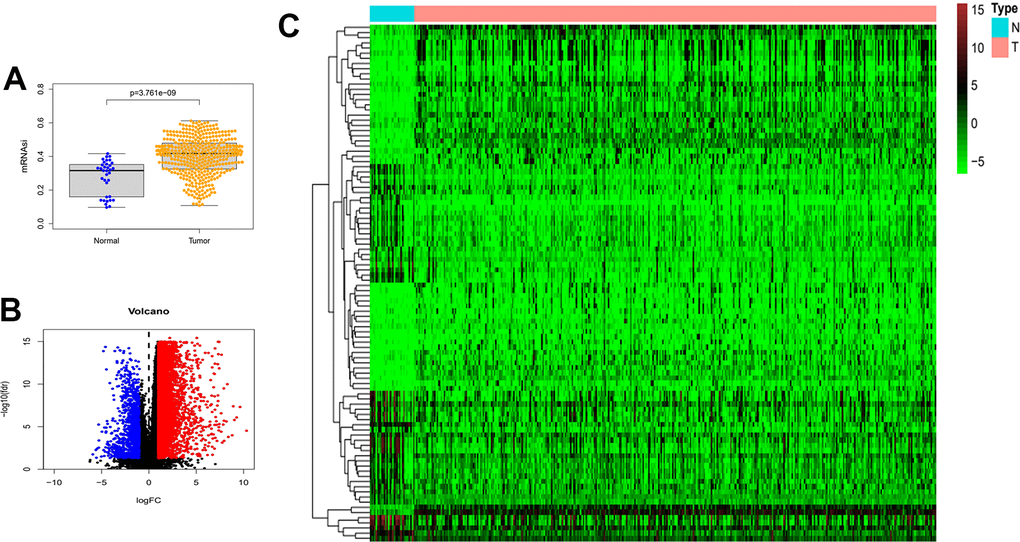
Figure 1.Differences in mRNAsi and sample gene expression. (A) Differences in mRNAsi between normal and tumor tissues in gastric cancer. (B) Volcano map of differentially expressed genes. Green dots represent genes that are down-regulated, red dots represent genes that are up-regulated, and black dots represent no significant change. (C) The top 50 differentially expressed genes in GC cancer disease presented as a gene expression heat map. P<0.05. GC: gastric cancer.