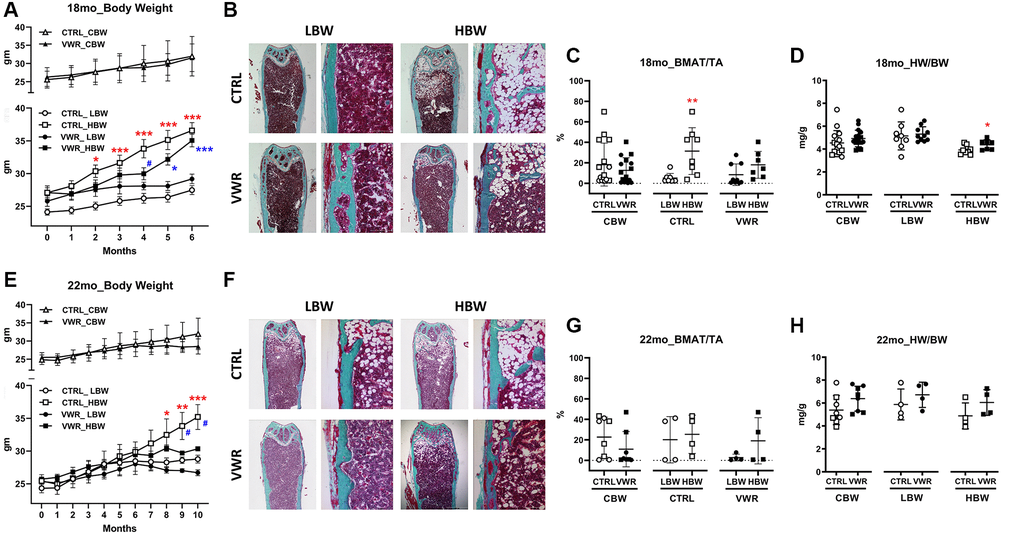
Figure 1.Body weight, bone marrow adipose tissue, and heart weight during aging. The low body weight, LBW, and high body weight, HBW, groups showed differences in bone marrow adipose tissue. 6 mo endurance exercise increased heart weight in the HBW subgroup. (A) The body weight of 18 mo. *: p < 0.05 and ***: p < 0.001, CTRL/HBW vs. CTRL/LBW mice (red asterisks). *: p < 0.05 and ***: p < 0.001, VWR/HBW vs. VWR/LBW mice (blue asterisks). #: p < 0.05, VWR/HBW vs. CTRL/HBW mice. (B and C) Bone marrow adipose tissue/total area (BMAT/TA) ratio in 18 mo. **: p < 0.01, CTRL/HBW vs. CTRL/LBW mice. (D) Heart muscle weight/body weight (HW/BW) ratio in 18 mo. *: p < 0.05, CTRL/HBW vs. VWR/HBW mice. (E) The body weight of 22 mo. *: p < 0.05, **: p < 0.01, and ***: p < 0.001, CTRL/HBW vs. CTRL/LBW mice. #: p < 0.05, VWR/HBW vs. CTRL/HBW mice. (F and G) Bone marrow adipose tissue/total area (BMAT/TA) ratio in 22 mo. (H) Heart muscle weight/body weight (HW/BW) ratio in 22 mo (D). Abbreviations: CTRL: control group; VWR: voluntary wheel running group; CBW: Combined groups; LBW: Low body weight group; HBW: High body weight group.