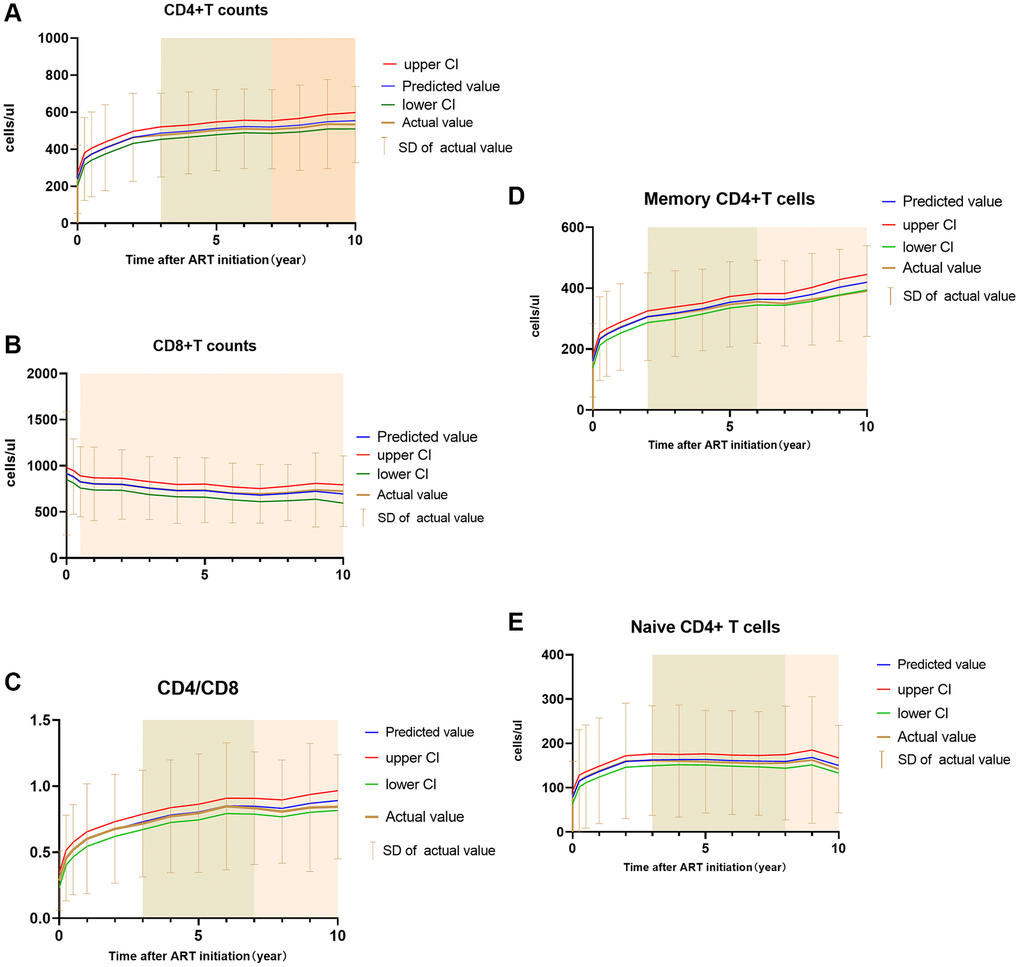
Figure 1.Fitted curve of estimated trends and calculated mean with SD of the count CD4+T cell (A), CD8+T cell (B), CD4/CD8 (C), Memory CD4+T cell (D) and Naïve CD4+T cell (E). Notes: predicted value means the predicted indicators calculated by the mixed linear model used in the article, upper CI and lower CI means the upper confidence interval and lower confidence interval of predicted value. Actual value and SD were calculated from original data. The green shade represented a significant change during 2–3 year interval, the pink shade represented no significant change during that time.