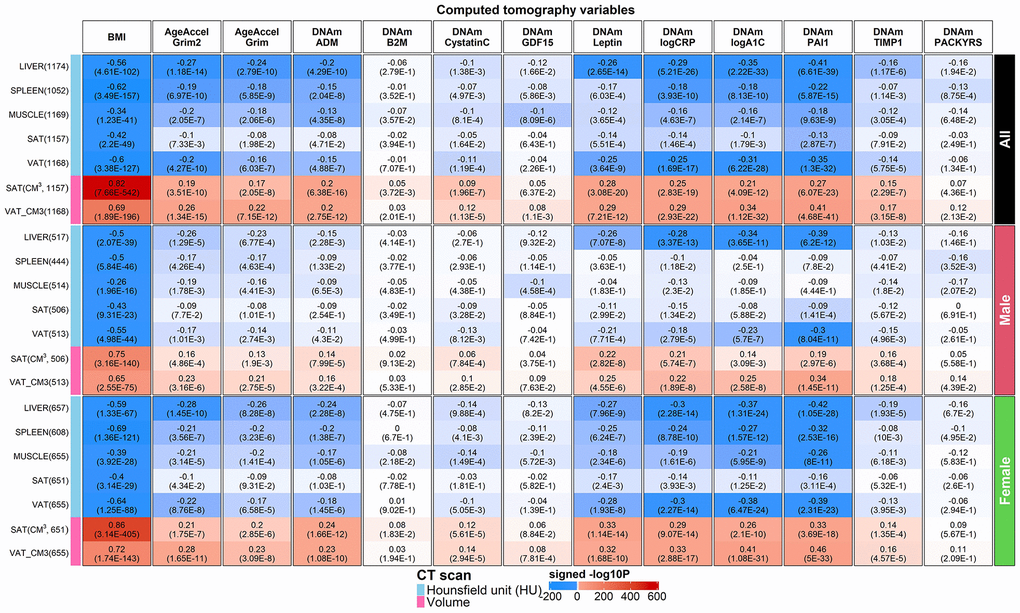
Figure 7.Computed tomography variables versus BMI and age-adjusted DNAm biomarkers in the FHS. Robust correlation coefficients (biweight midcorrelation [26]) between 1) AgeAccelGrim2, AgeAccelGrim, and ten age-adjusted DNAm-based surrogate biomarkers underlying DNAmGrimAge2, and 2) seven computed tomography-derived organ density measures (Hounsfield units) or volumetric measures for subcutaneous adipose tissue (SAT CM3) or visceral adipose tissue (VAT CM3). The y-axis lists computed tomography variables in the format of name (sample size in FHS), annotated by variable type. The x-axis lists body mass index (BMI), AgeAccelGrim2, AgeAccelGrim, followed by DNAm variables in alphabetical order. Each cell presents bicor (P-value). P-values are unadjusted and reported based on linear mixed analysis with pedigree as random effect to avoid confounding by pedigree structure. The color gradient is based on -log10 P-values times sign of bicor. We applied the correlation analysis to males and females, respectively, and then combined the results via fixed effect models weighted by inverse variance (listed in the top rows, denoted as “ALL”). The heatmap presents the results based on ALL and stratification results by gender, annotated on the right side.
Figure 7 — DNA methylation GrimAge version 2 | Aging