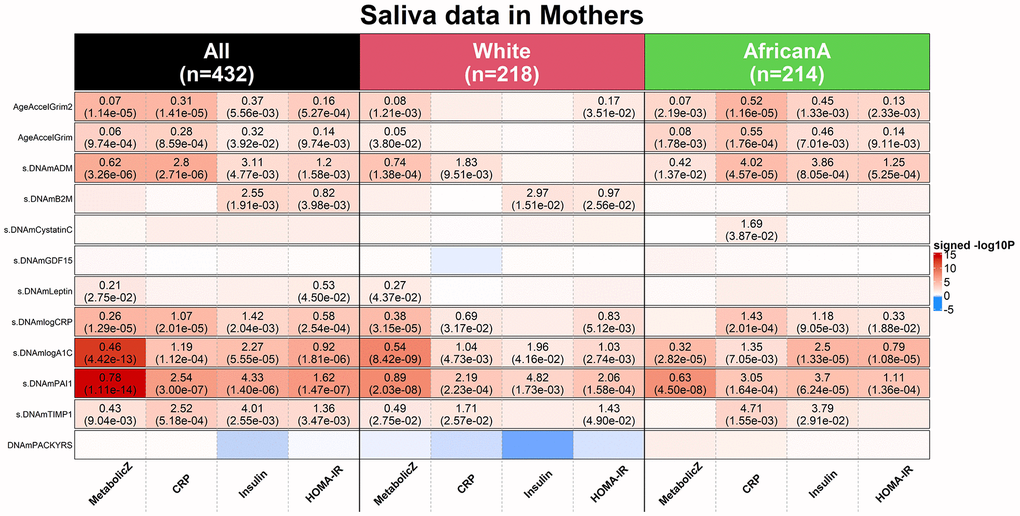
Figure 8.Applications of DNAm GrimAges on saliva methylation data in NGHS. DNAmGrimAge, DNAmGrimAge2 and its components were estimated in saliva methylation data from mothers. Linear regression analysis was performed to study the association between 1) dependent variables: clinically relevant measures: metabolic Z score, high sensitivity C-reactive protein (CRP), insulin resistant and HOMA for insulin resistance (HOMA-IR) [32] and 2) independent variables: AgeAccelGrim2, AgeAccelGrim, and nine scaled DNAm-based surrogates of proteins and DNAmPACKYRS. Regression models were performed in all mothers (n=432) and stratified by ethnic/racial groups: White (n=218) and African American (n=214). Analysis was adjusted for age and batch effect and adjusted for race as needed. The y-axis lists DNAm-based variables and the x-axis lists the clinically relevant measures. Each cell presents beta coefficient (P-value), provided P< 0.05 from the regression analysis. The color gradient is based on -log10 P-values times sign of beta coefficient. All P-values are unadjusted.