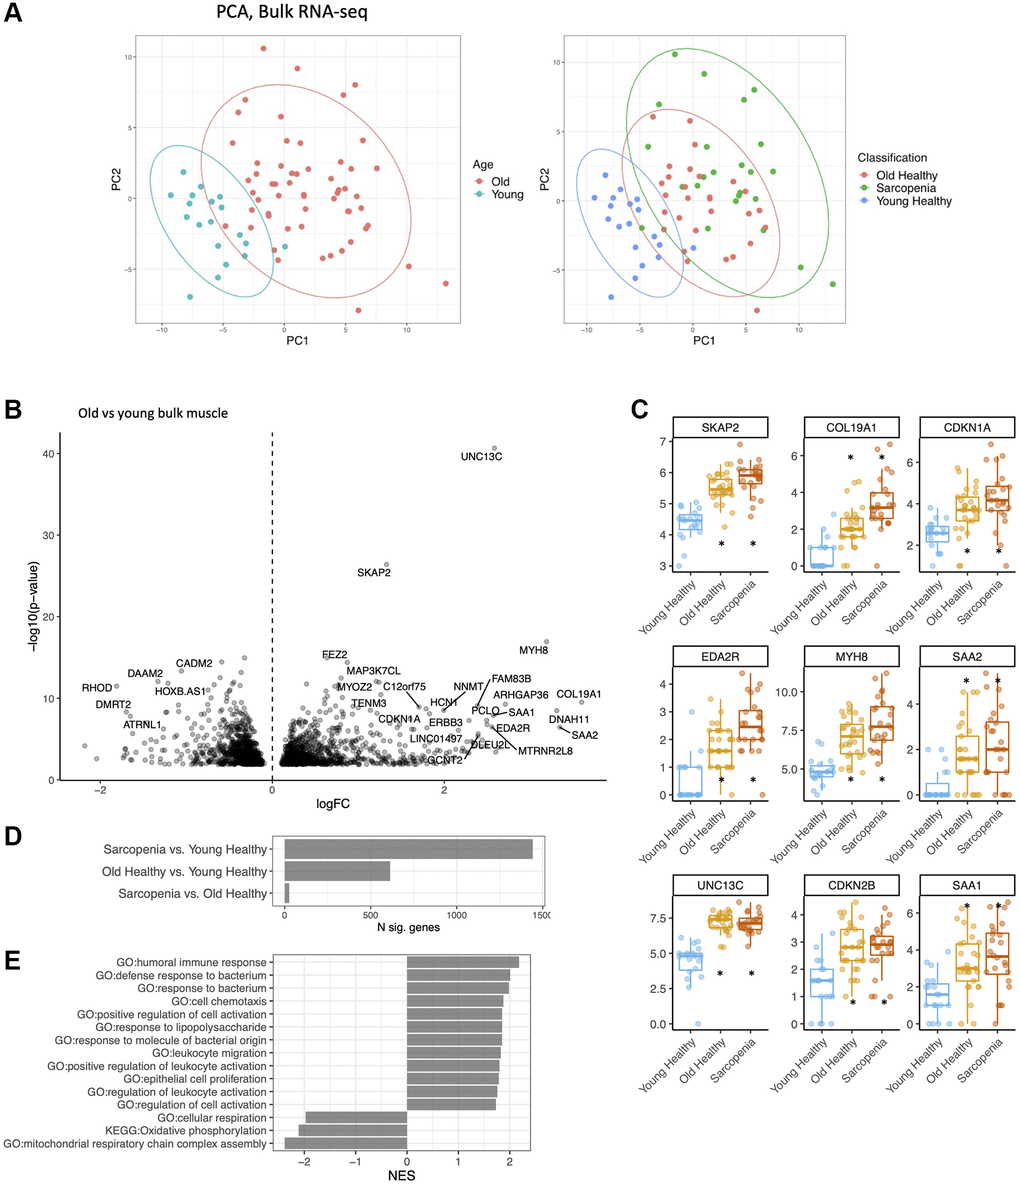
Figure 1.Bulk RNA-seq identifies major gene expression changes in muscle with age. (A) Principal component analysis (PCA) of bulk young, old and frail skeletal muscle. (left) Young (less than 20 years old) in blue, old (more than 65 years old) in red. (right) Young (blue), old (red), frail subjects (green). (B) Volcano plot of expression changes in old vs. young muscle. Labelled top 30 by abs (logFC) × -loglO (p-value). (C) Log (CPM) of MYH8, COL19Al, MTRNL8, CDKNlA, CDKN2B, AREG in young (green), old (blue) and frail subjects (red). Boxplot shows 25% percentile, 75% percentile and median. Stars were added when significant compared to young healthy (q < .01). (D) Number of DEGs per comparison. (E) Pathway analysis of dysregulated genes with age using KEGG, GO database (GSEA).