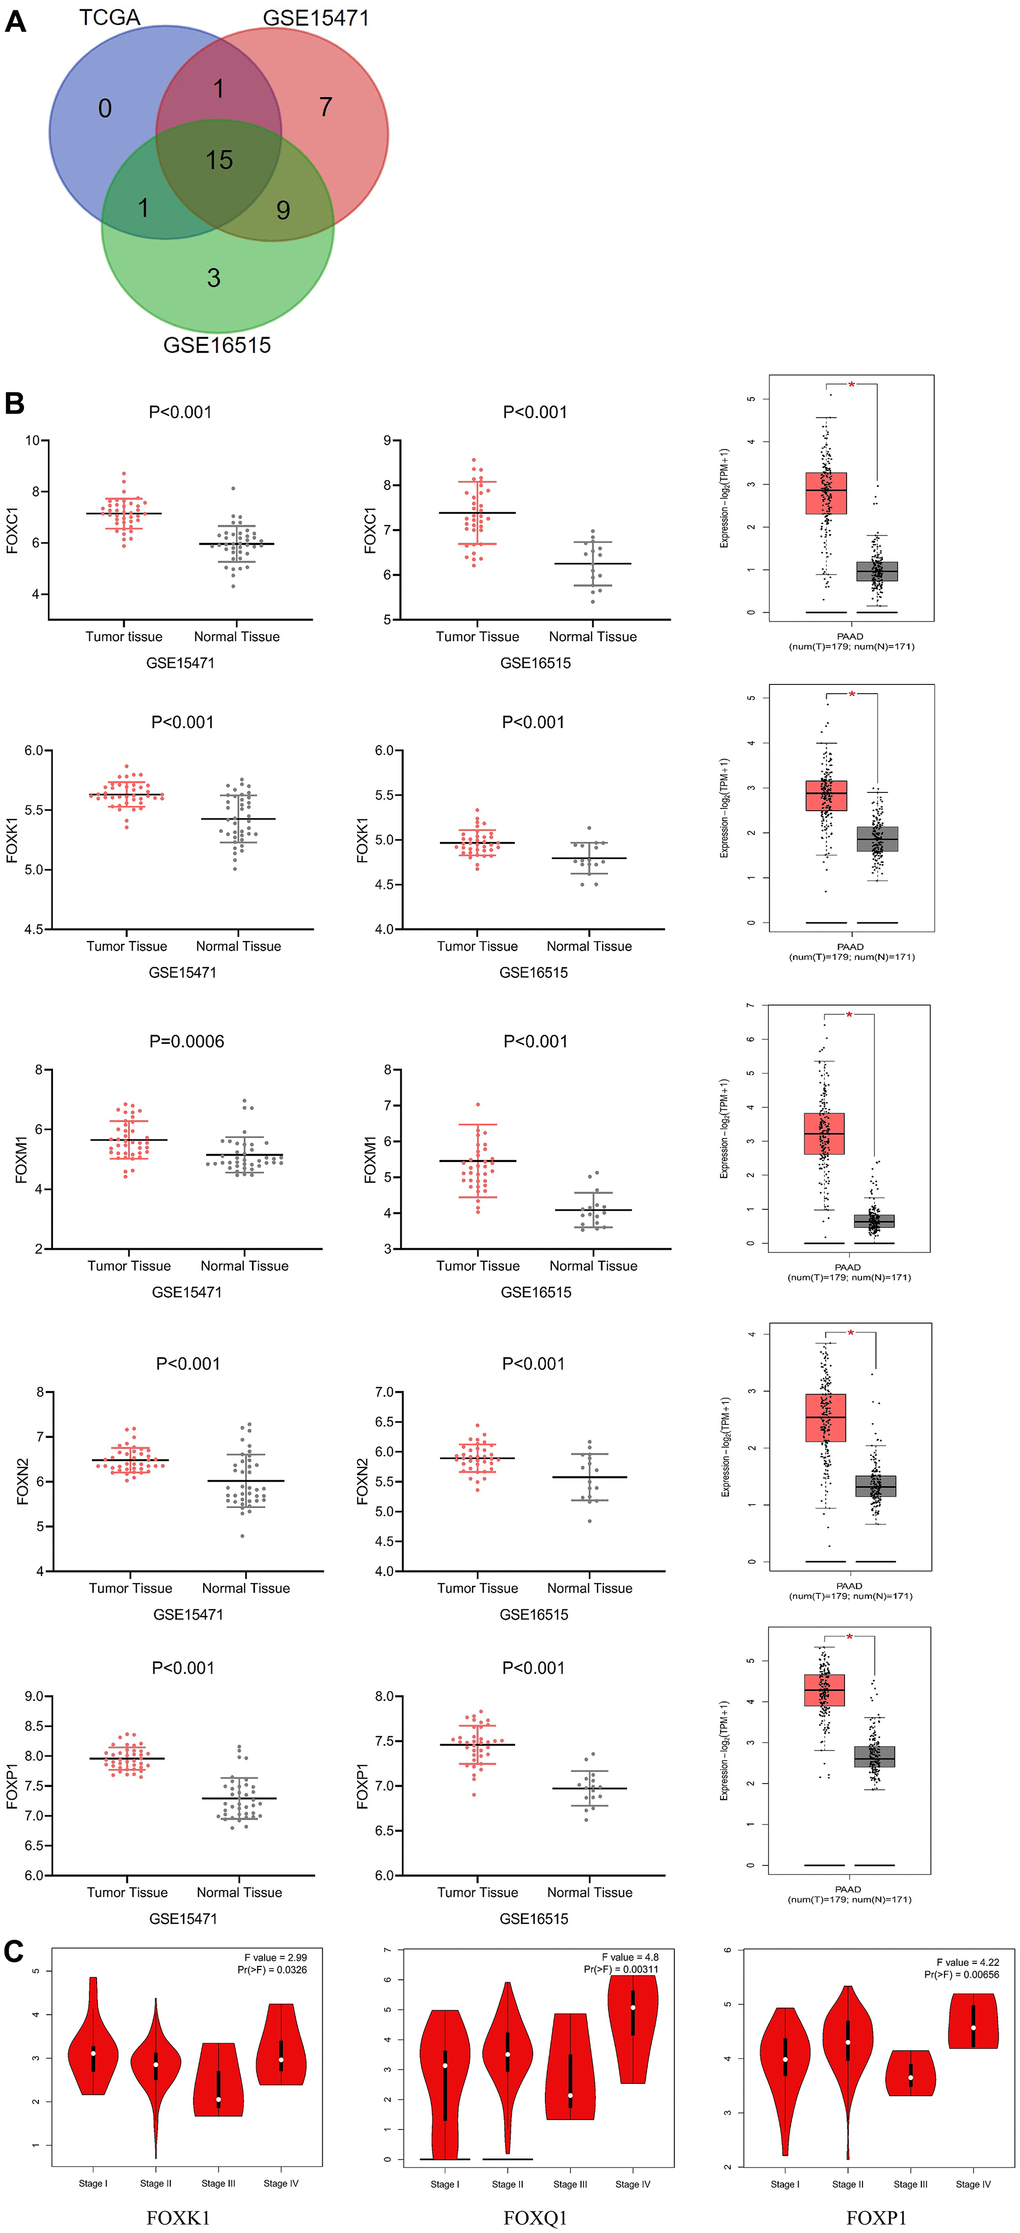
Figure 1.Differential expression and correlation with tumor stages of FOXs in PAAD patients. (A) Differentially expressed genes were selected with P < 0.01 and |Log2FC| Cutoff ≥1 among the datasets GSE15471, GSE16515, and TCGA. The Venn diagram shows an overlap of 15 genes that had higher expression in cancer tissues than in adjacent tissues. (B) Expression of representative FOXs in PAAD (GSE15471, GSE16515 and GEPIA). GSE15471: number(normal)=39, number(tumor)=39; GSE16515: number(normal)=36, number(tumor)=16. (C) Correlations between FOX expression and tumor stage in PAAD patients (TCGA). The expression of FOXK1, FOXQ1, and FOXP1 was correlated with the pathological stage of PAAD patients (p < 0.05). PAAD: pancreatic adenocarcinoma.