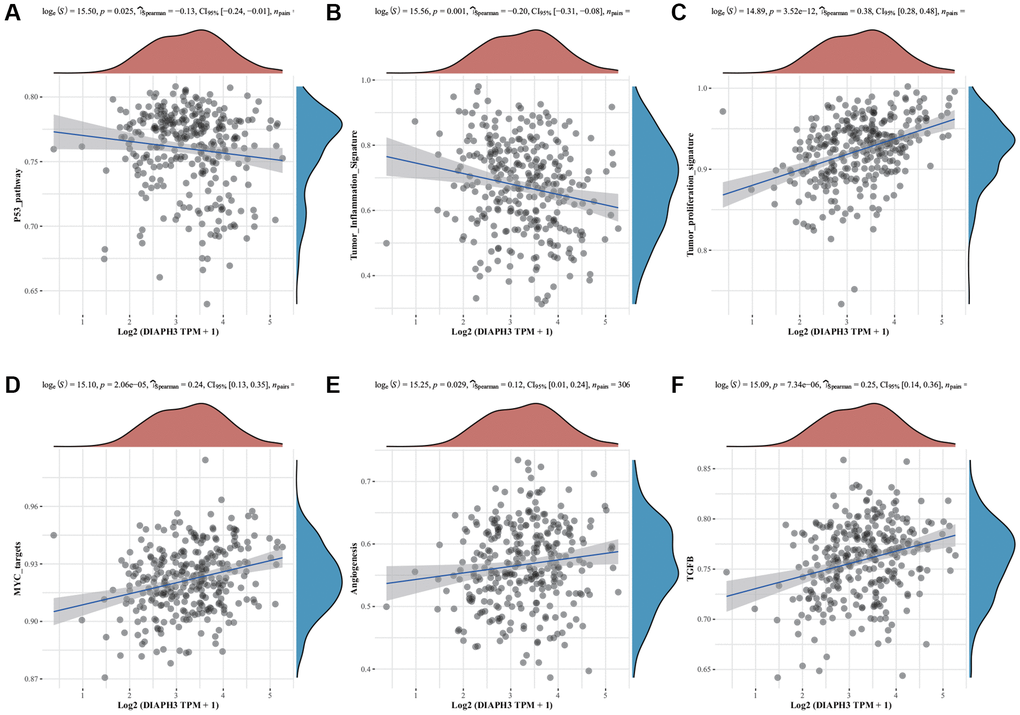
Figure 6.Single-sample Gene Set Enrichment Analysis (ssGSEA) of Diaphanous Related Formin 3 (DIAPH3). (A) The correlation between DIAPH3 expression and the p53 signal pathway. (B) The correlation between DIAPH3 expression and the characteristics of tumor inflammation. (C) The correlation between DIAPH3 expression and tumor proliferation. (D) The correlation between DIAPH3 expression and Myc target genes. (E) The correlation between DIAPH3 expression and angiogenesis. (F) The correlation between DIAPH3 expression and transforming growth factor-beta (TGF-β) signal pathway. The abscissa represents the gene expression; the ordinate represents the pathway score; the density curve on the right represents the distribution trend of the pathway score; the upper-density curve represents the distribution trend of gene expression. The uppermost value (the blue curve in the coordinate axis) represents the p-value, the correlation coefficient, and the correlation calculation method.