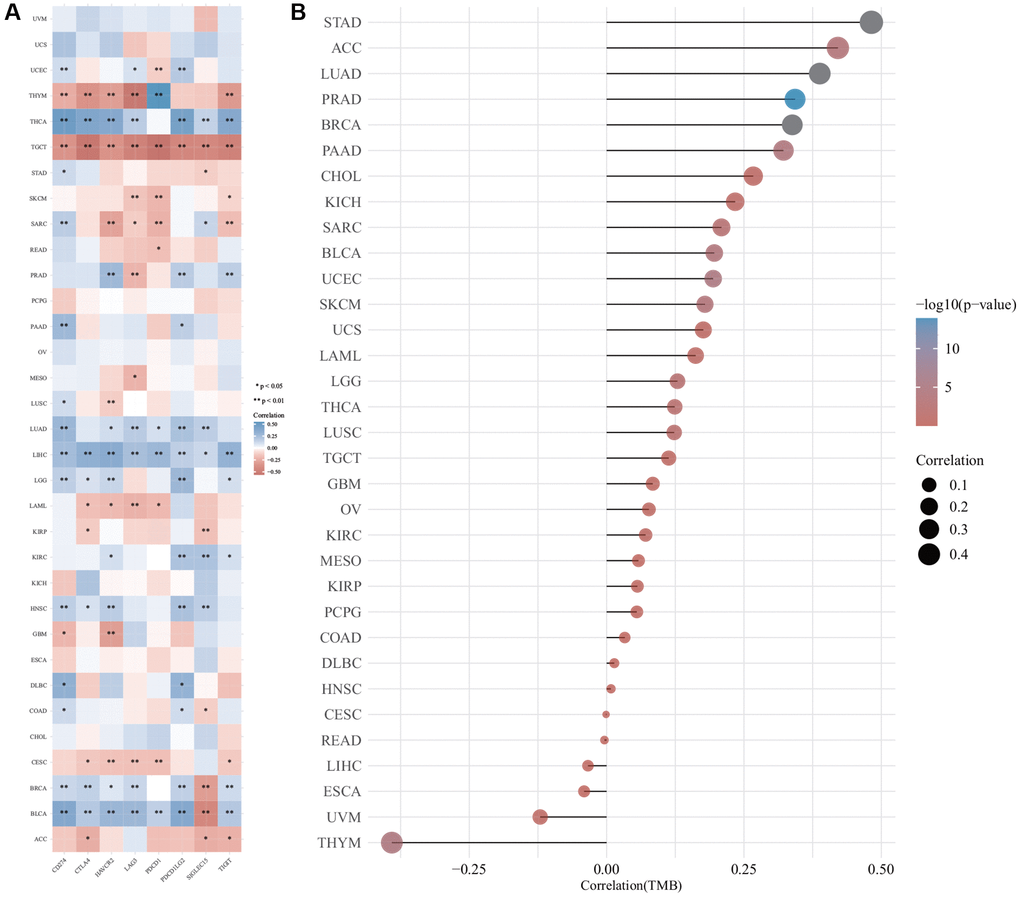
Figure 9.The correlation of Diaphanous Related Formin 3 (DIAPH3) expression was analyzed by immune checkpoint and tumor mutation burden (TMB). (A) The heat map of immune checkpoint and DIAPH3 expression in different cancer tissues, in which abscissa represents different immune checkpoint genes; ordinate represents different cancer tissues. Each box in the picture represents the correlation analysis of selected gene expression and immune checkpoint-related gene expression in the corresponding tumor, *p < 0.05, **p < 0.01, ***p < 0.001. The asterisk represents the degree of importance (*p), and different colors represent the change in correlation coefficient. (B) The correlation analysis of TMB and DIAPH3 gene expression. The abscissa represents the correlation coefficient between gene and TMB; the ordinate represents different tumors; dot size represents correlation coefficient; different colors represent significant p-value; the deeper the blue color in the diagram, the smaller the p-value.