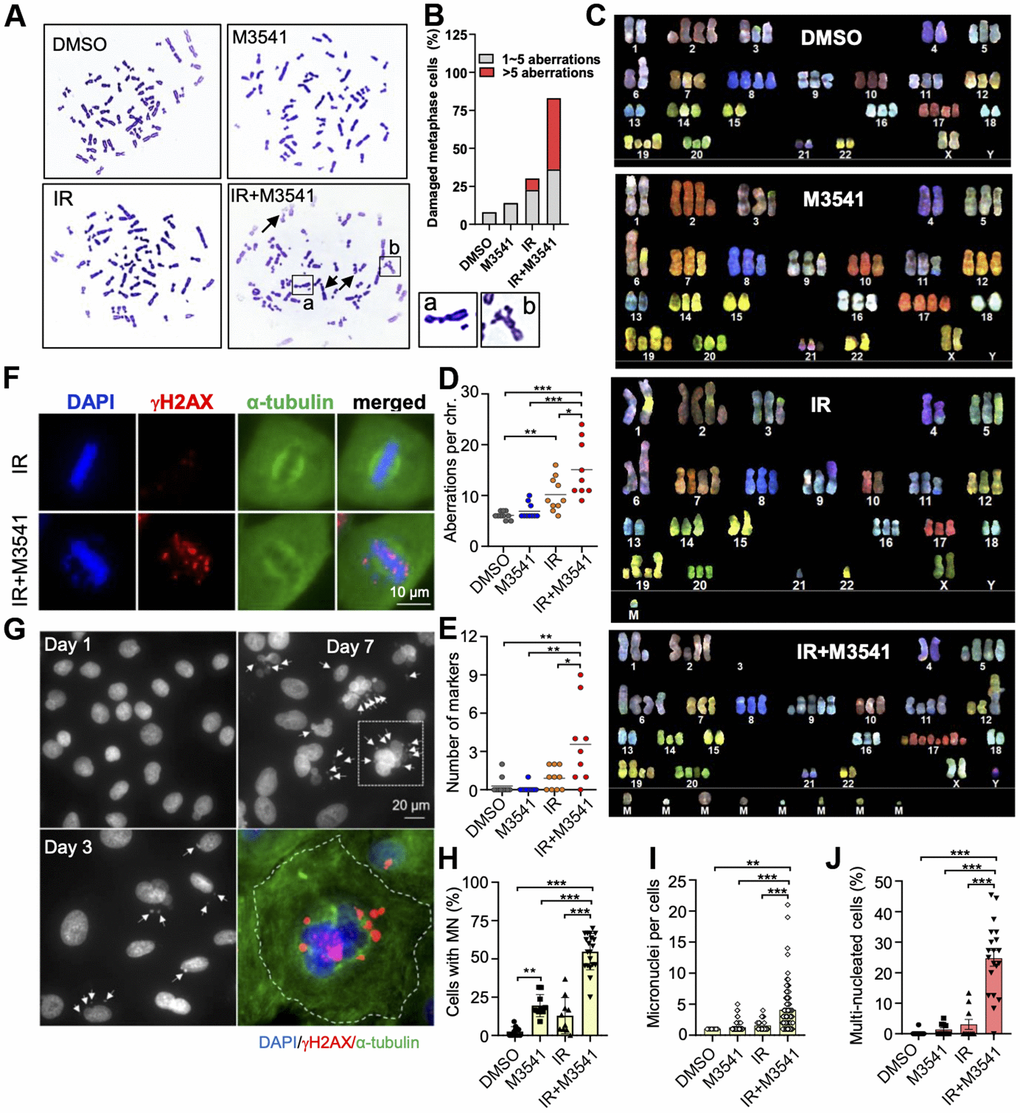
Figure 3.Exposure to M3541 leads to gross chromosomal aberrations and intense micronucleation in irradiated cancer cells. (A) Metaphase spread images of A549 cells exposed to DMSO, M3541, IR or combination of IR+M3541 for 24 h. Examples of chromosome aberrations are shown from representative images. (B) Quantification of chromosome aberrations including broken and deformed chromosomes from (A). (C) Spectral karyotyping (SKY) analyses of A549 exposed as above. (D) Quantification of chromosome aberrations, including insertion, duplication, deletion, translocation and chromatid breaks. (E) Number of unidentifiable chromosome markers (M) in each metaphase spread subjected to SKY analyses. (F) Mitotic cells imaged by immunofluorescence staining of DNA (DAPI), mitotic spindle (anti-α-tubulin) and unrepaired DSBs (anti-γH2AX). Proliferating A549 cells were exposed to IR or IR+M3541 enriched in G2 phase cells by the CDK1 inhibitor RO-3306 for 16h and released for 45 min to enrich in mitotic cells. (G) Micronuclei imaging analysis of A549 cells exposed to IR+M3541 for 1, 3 and 7 days by immunofluorescence with DAPI staining. Representative images are shown. Micronuclei were co-stained for γH2AX in the zoomed image. (H) Quantification of the percentage of cells with micronuclei in A549 cells exposed to DMSO, M3541, IR or both for 7 days. Data represent mean±SEM (N=2). (I) Number of micronuclei per cells and (J) Percentage of cells with > 2 nuclei. Data represent mean±SEM (N=2).