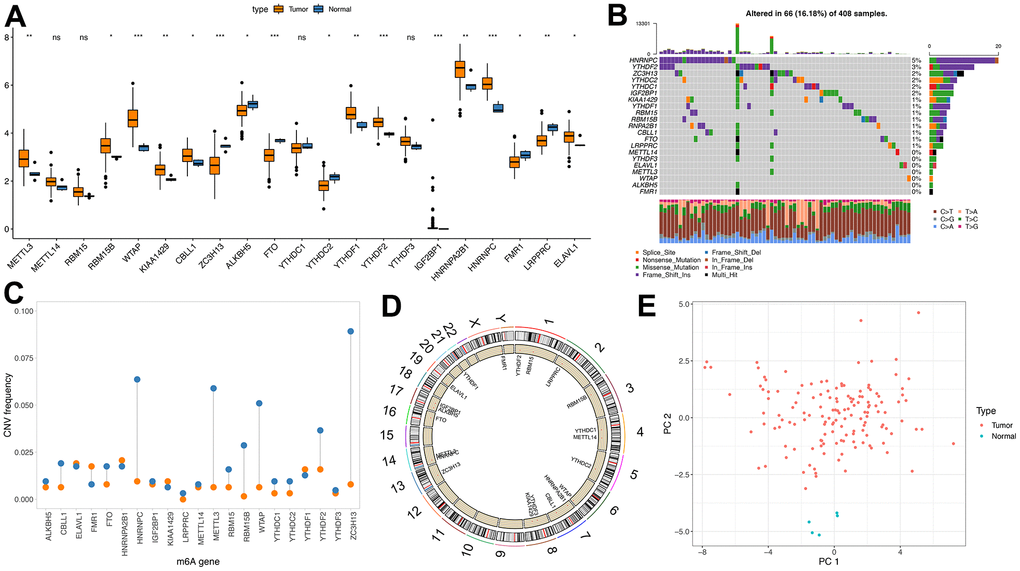
Figure 1.Genetic variation of m6A regulator. (A) m6A expression of tumor and normal samples in TCGA; (B) Distribution of m6A gene mutations and different mutation types; (C) CNV incidence of m6A gene, blue indicates deletion and orange indicates amplification; (D) Position of m6A gene on chromosome; (E) PCA results of m6A gene in TCGA samples).