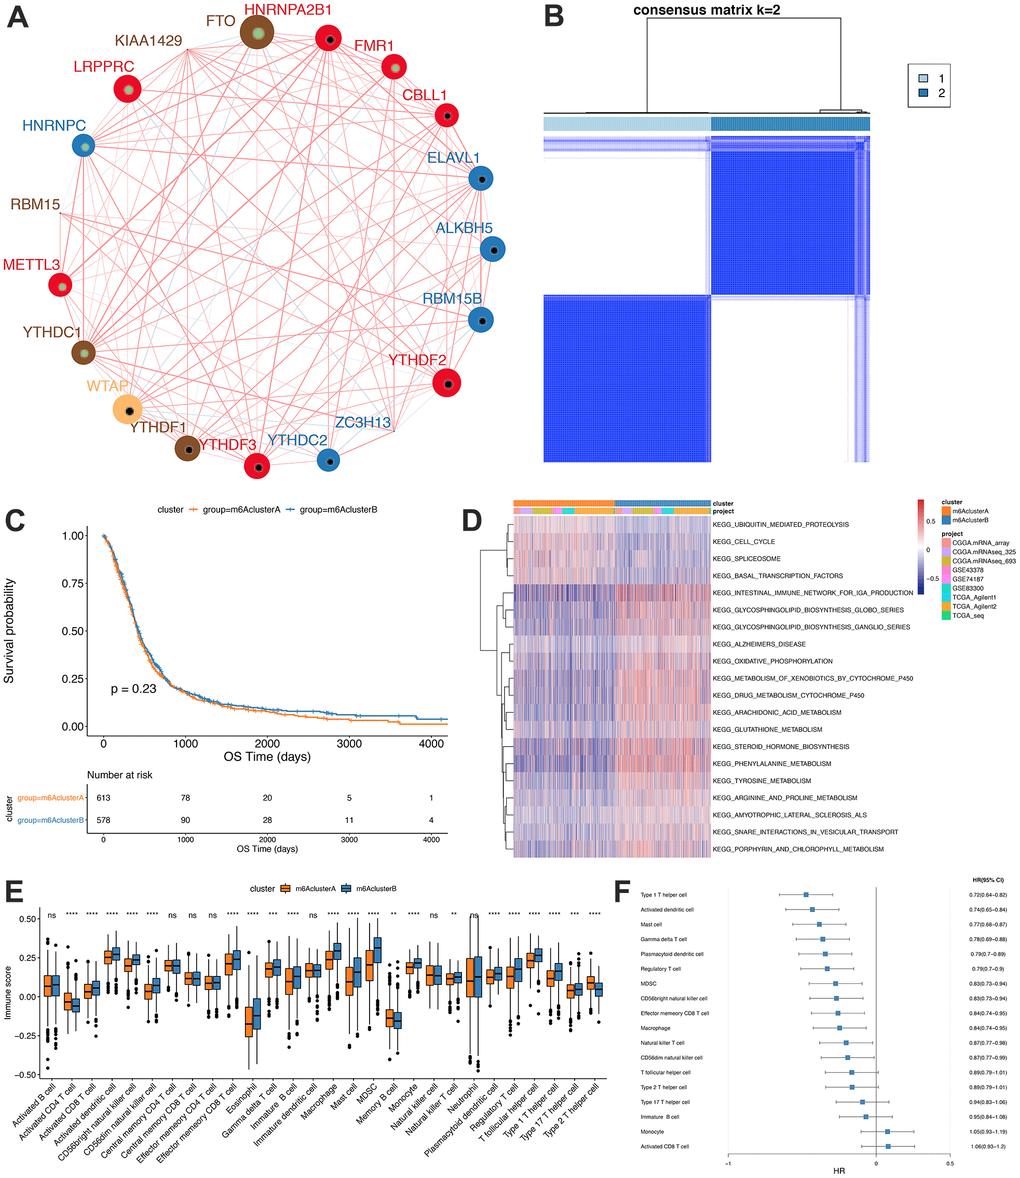
Figure 2.Unsupervised clustering of m6A genes in low-grade glioma samples. (A) Interaction between m6A genes. The size of the circle indicates the impact of each gene on survival prediction, and the larger the expression, the more relevant the prognosis. In the circle the green dots in the circle indicate prognostic protective factors, and the black dots in the circle indicate prognostic risk factors. The lines connecting genes show their interactions. The negative correlations are marked in blue and positive correlations in red. Gene clusters ABC are marked respectively in blue, red and brown; (B) Consistent clustering of m6A genes; (C) Kaplan-Meier curve showed no significant survival differences in two m6Aclusters; (D) GSVA enrichment analysis, showing the biological pathways with different m6Aclusters Activation state. Heat map is used to visualize these biological processes, red means activation and blue means inhibition; (E) Distribution of immune infiltration of 28 immune cells in two m6Aclusters; (F) Differential cell prognosis analysis.