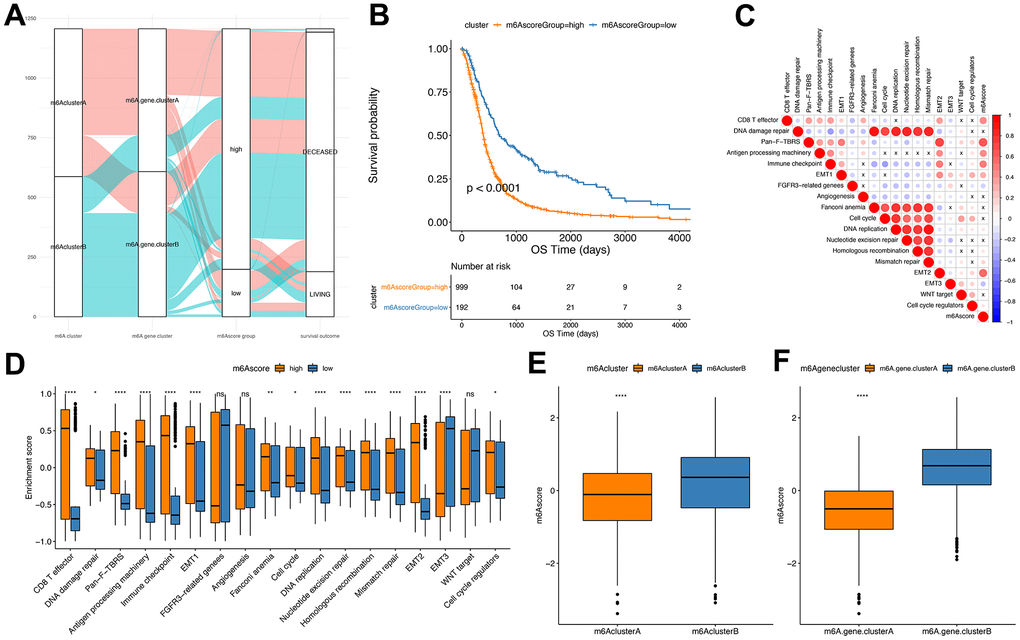
Figure 6.Establishment of m6Ascore. (A) Alluvial plot showing the changes of m6A cluster, gene cluster and m6Ascore; (B) Kaplan-Meier curve shows that m6Ascore high and low grouping has a significant relationship with overall survival rate; (C) Using Pearson analysis, the correlation between m6Ascore and known gene features in GBM. Negative correlation is marked in blue, and it is positively correlated with red. X in the figure indicates that the correlation is not significant, and the larger the circle, the more significant; (D) The distribution of the enrichment scores of known gene features in the m6Ascore high and low group samples in the TCGA+CGGA+GEOdata set (***P<0.01, ****P<0.001); (E) The distribution of m6Ascore in m6Acluster (****P<0.001); (F) Distribution of m6Ascore in m6Agenecluster (****P<0.001).