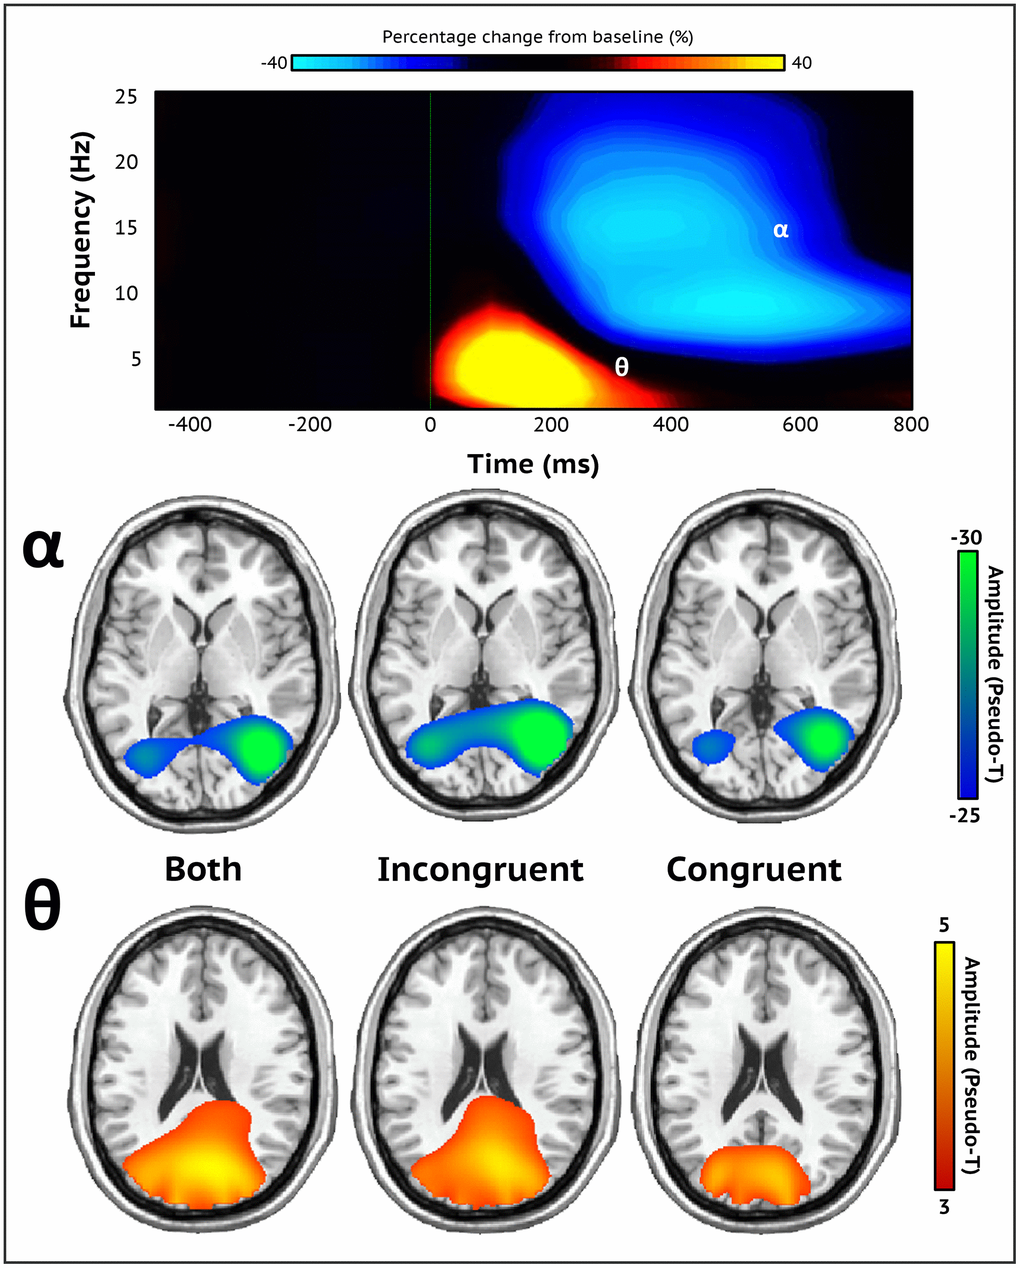
Figure 2.Sensor-level spectrograms and whole-brain averages. A time-frequency spectrogram illustrating task-specific oscillatory activity averaged across all trials, conditions, and participants (top). Time (ms) is on the x-axis and frequency (Hz) is presented on the y-axis. The color bar above the spectrogram indicates the percent change in amplitude from baseline. Robust increases in theta (3-6 Hz; 0-350 ms) and decreases in alpha activity (8-16 Hz; 200-600 ms) were found in occipito-parietal sensors (MEG1932). Both oscillatory responses significantly differed from baseline (p < .001, corrected). Stimulus onset (0 ms) is indicated by the dotted green line. Each brain image depicts the grand average across all participants of both, incongruent, and congruent trial conditions for each neural response (bottom). Strong theta oscillations were generated by neuronal populations in the bilateral primary visual cortices, while alpha oscillations were distributed across the lateral occipital cortices bilaterally. The color scale bar per neural response appears to the right in amplitude per voxel.