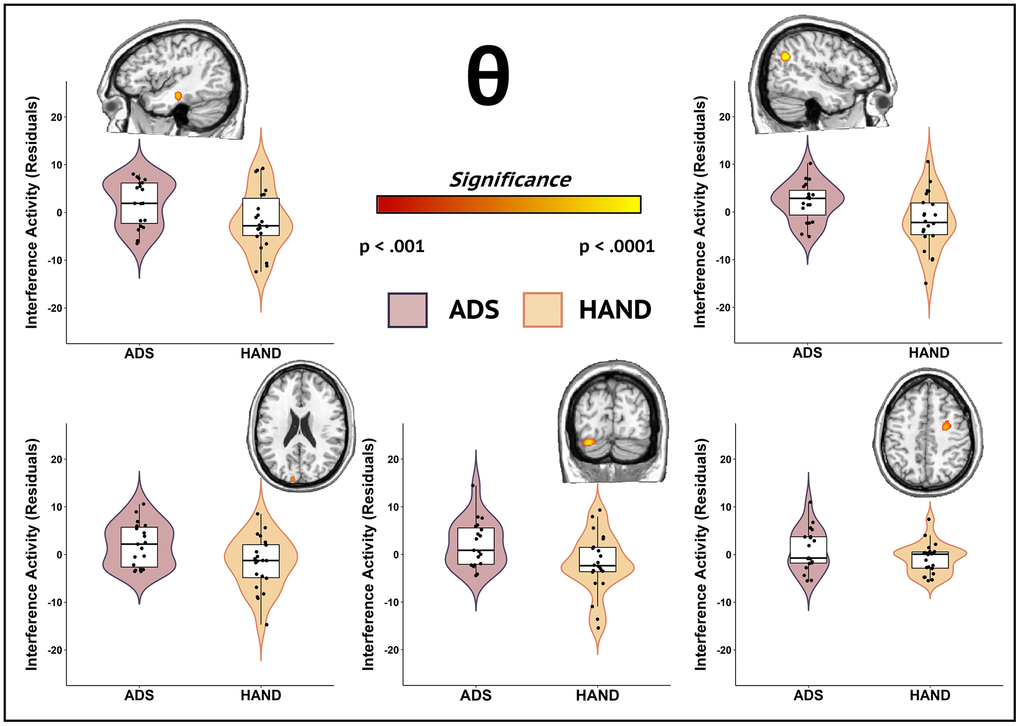
Figure 4.Participants in the ADS group exhibited stronger theta interference activity compared to those in the HAND group during attentional processing. Whole-brain group comparison maps of theta interference activity are shown. Images for each significant cluster of activity are accompanied by the violin plots of the amplitude values for the peak voxel. Group differences (p < .001, corrected) were identified in the left middle temporal gyrus (top left), right superior parietal cortex (top right), left middle occipital cortex (bottom left), right lingual gyrus (bottom middle), and right dorsolateral prefrontal cortex (bottom right). Residuals of amplitude values controlling for age are given with each corresponding brain slice.