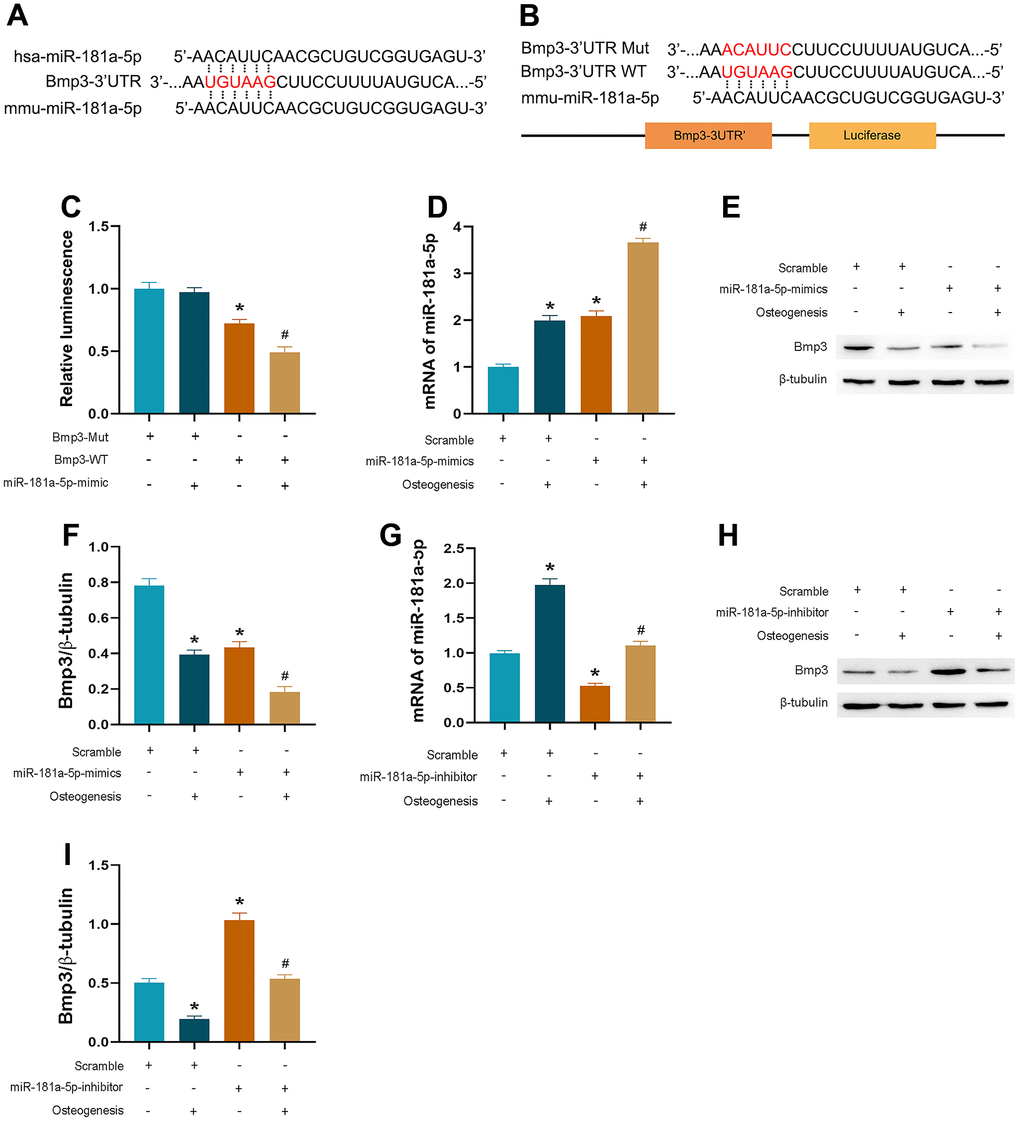
Figure 6.miR-181a-5p targeted on BMP3. (A, B) The sequence of BMP3-3’ UTR WT or BMP3-3’ UTR Mut luciferase constructs. (C) Relative luminescence of scramble and miR-181a-5p mimic transfected cells which are contransfected with BMP3-3’ UTR WT or BMP3-3’ UTR Mut luciferase constructs. Data represent mean ± s.e.m. of the ratio to the value of scramble in BMP3-Mut transfected cells. *P<0.05 compared with the scramble and BMP3-Mut contransfected cells. # P<0.05 compared with the scramble and BMP3-WT contransfected cells. (D) PCR verification of miR-181a-5p mimic transfection efficiency. (E, F) BMP3 and beta-tubulin protein levels in miR-181a-5p mimic transfected cells. BMP3 is normalized to beta-tubulin. *P<0.05 compared with the scramble group treated with saline. #P<0.05 compared with the miR-181a-5p mimic group treated with saline. (G) PCR verification of miR-181a-5p inhibitor transfection efficiency. (H, I) BMP3 and beta-tubulin protein levels in miR-181a-5p inhibitor transfected cells. BMP3 is normalized to beta-tubulin. *P<0.05 compared with the scramble group treated with saline. #P<0.05 compared with the miR-181a-5p inhibitor group treated with saline. All data represent mean ± s.e.m. (n = 6).