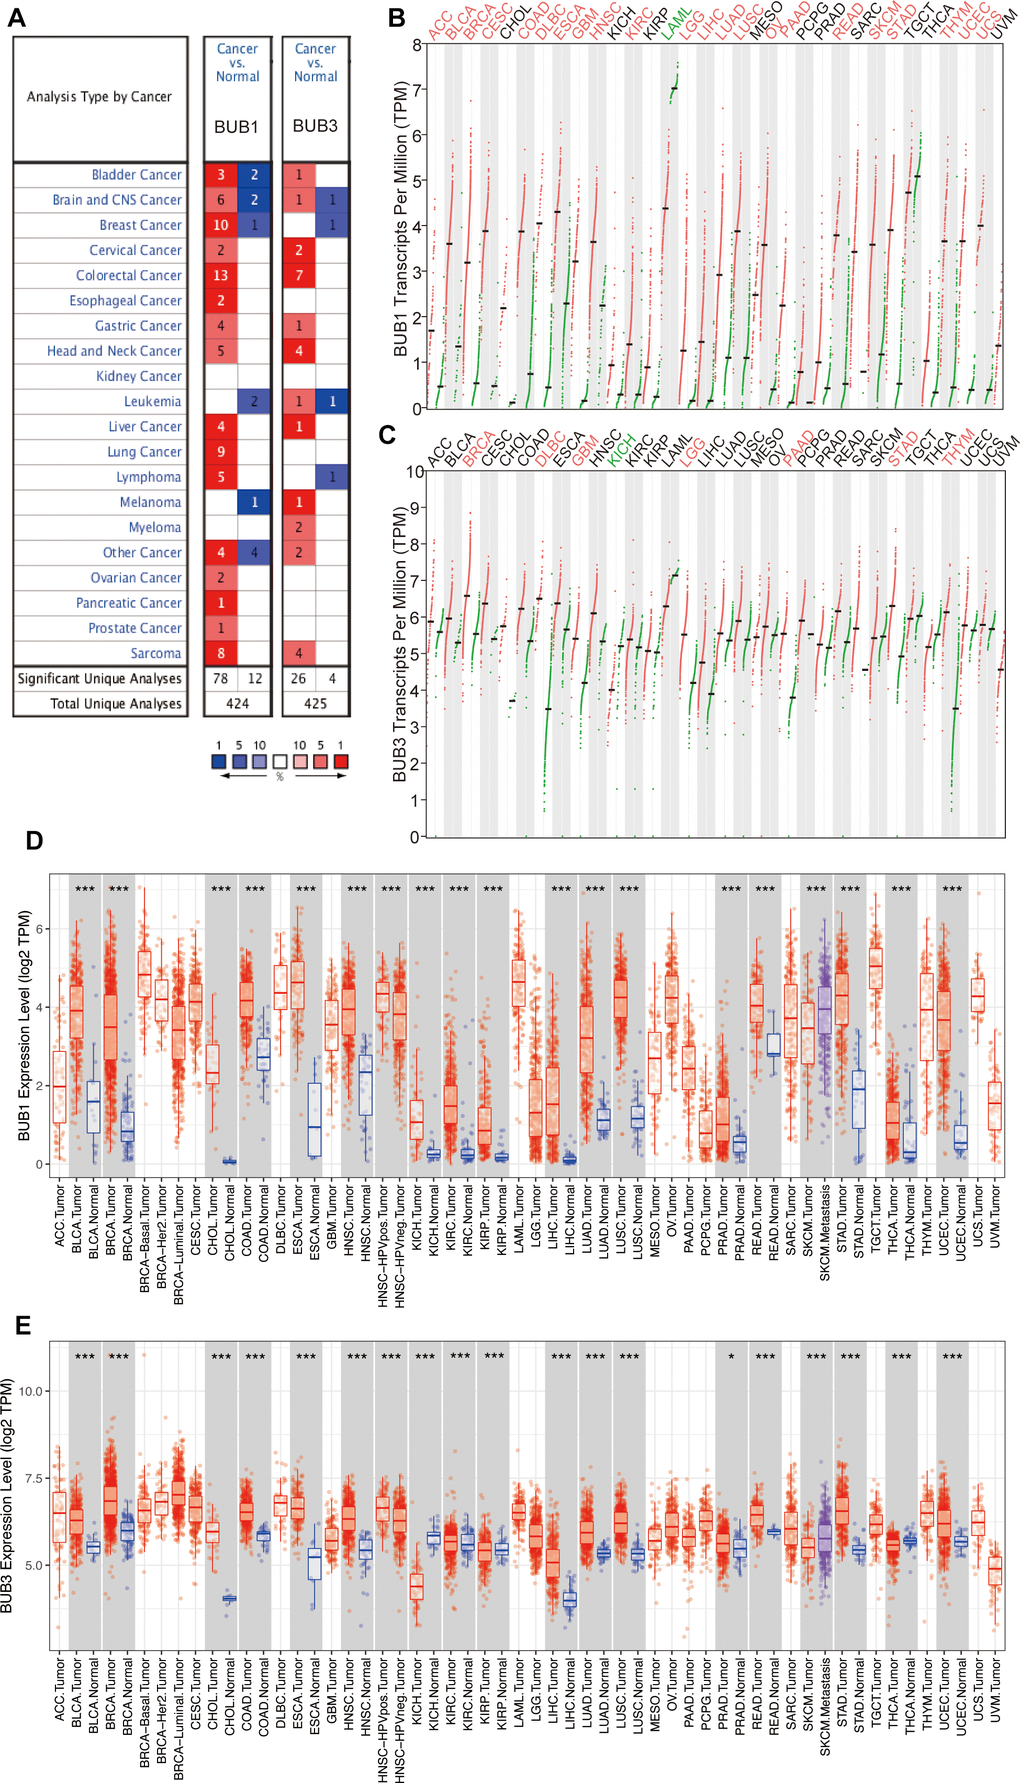
Figure 2.Differential expression of BUB1/3 at transcriptional levels in different cancers. (A) BUB1/3 mRNA expression in 20 different types of cancers analyzed using the data in the Oncomine platform. Red represents high expression levels, and blue represents low expression levels. p <0.0001, multiple change = 2, gene grade = 10%. (B, C) Expression levels of BUB1 (B) and BUB3 (C) mRNAs in 33 cancer tissues and paired normal tissues obtained from the GEPIA database. p <0.05, | Log2FC | > = 2. (D, E) Expressions levels of BUB1 (D) and BUB3 (E) in cancer tissues and the corresponding normal tissues obtained from the TIMER database. Red, cancerous tissue; Blue, normal tissue. *, p <0.05; **, p <0.01; ***, p <0.001.