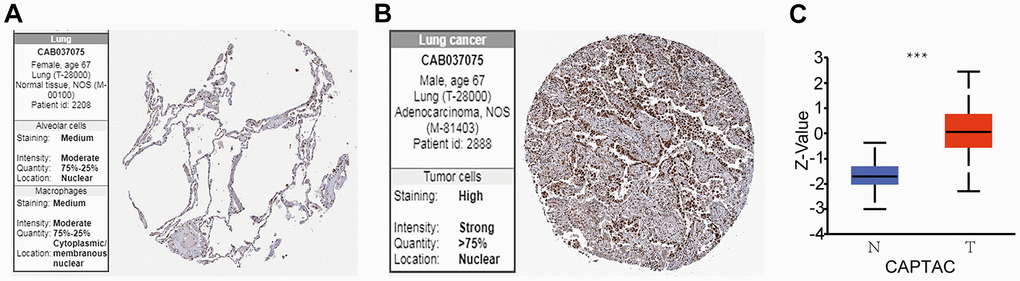
Figure 4.BUB3 protein expression levels in LUAD. (A, B) Protein expression of BUB3 in tumor and normal tissues; data obtained from the HPA. (C) Protein expression of BUB3 in LUAD and normal tissues; data obtained from the CAPTAC database (* p <0.05). The Z-value represents the standard deviation from the median (for the cancer types under being studied). The Log2 spectral count ratio from CAPTAC was first normalized for each sample profile. It was then normalized among the samples.