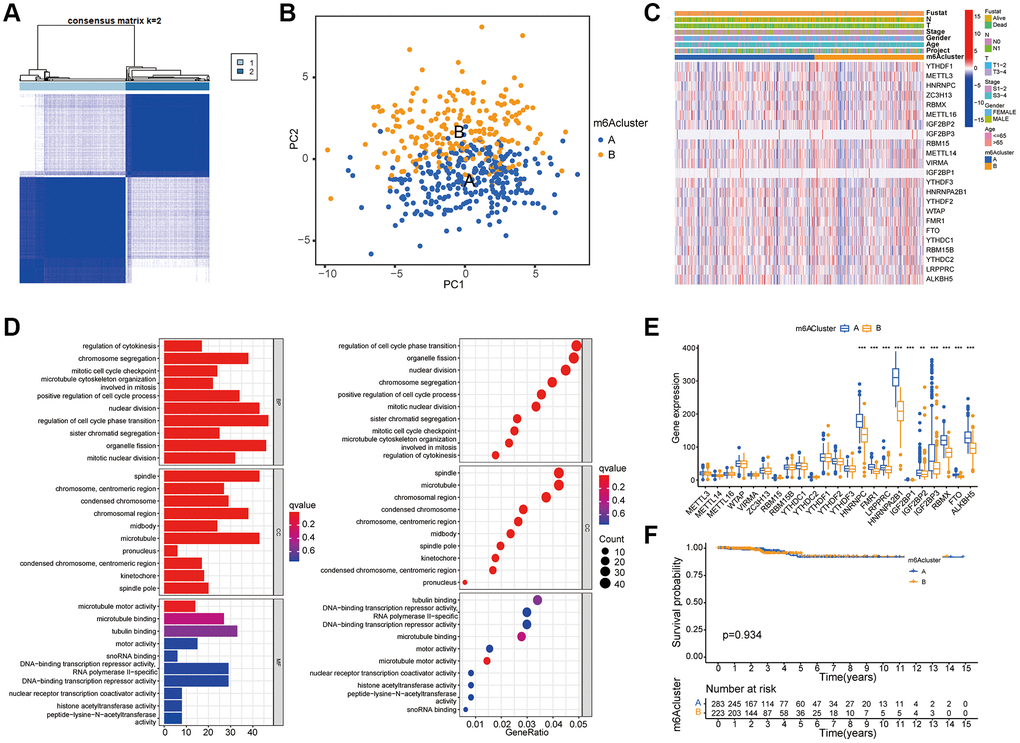
Figure 3.Determination of m6A modification mode. (A) According to the expression similarity of m6A RNA methylation regulator, 506 thyroid cancer patients in TCGA cohort were divided into m6A Cluster A and B. (B) PCA analysis shows that m6A related genes can distinguish the two groups of m6A genotyped samples. (C) The Heatmap shows an unsupervised cluster of 23 m6A regulators in TCGA-THCA. (D) GO enrichment analysis was performed on the difference genes screened by comparison between the two groups of m6A cluster to observe the functions of these genes. The ordinates of the histogram and bubble diagram represent the name of GO, which can be divided into three categories: BP (biological process), CC (Cell Component), and MF (Molecular function). (E) The expression of 23 m6A regulators in the two groups of m6A cluster. The asterisk indicates statistical P value (*P < 0.05; **P < 0.01; ***P < 0.001). (F) Survival analysis for RFS among two m6Aclusters. Kaplan–Meier curves and log-rank P values are shown in the graph, and the numbers at risk are shown at the bottom.