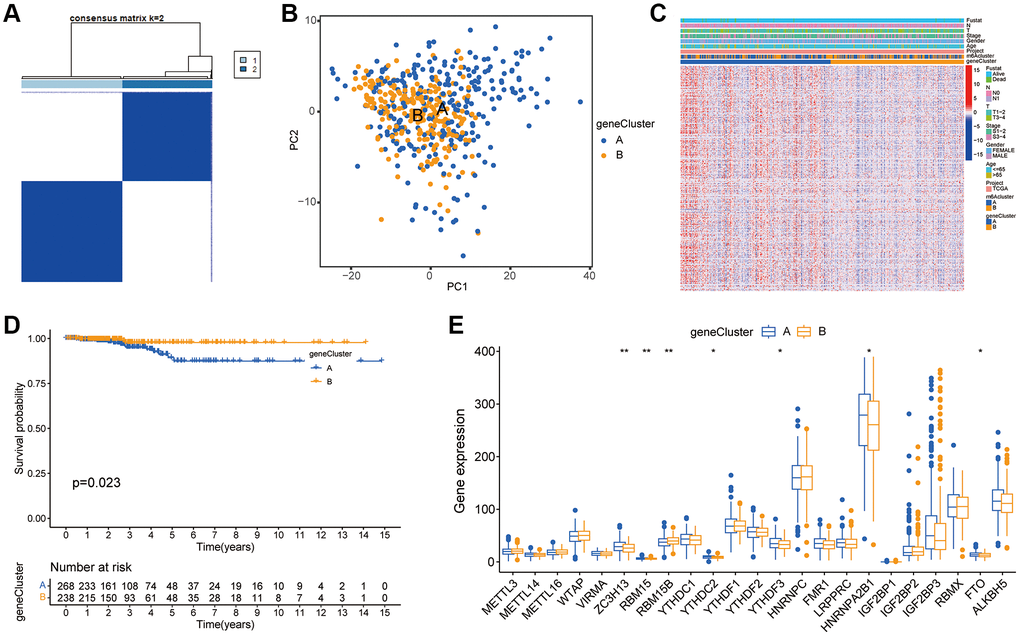
Figure 4.Construction of m6A gene subgroup. (A) By screening the overlapping DEGs between two m6A clusters and conducting unsupervised consensus cluster analysis, the samples are classified into two types according to the internal correlation. The types 1 and 2 correspond to gene cluster-A and gene cluster-B respectively. (B) PCA analysis shows that m6A related DEGs can distinguish two groups of m6A cluster samples. (C) Heatmap is drawn for m6A cluster of the two groups according to different types. The abscissa in the figure represents samples and the ordinate represents m6A related genes. (D) Kaplan-Meier curve is used to evaluate the survival of phenotypic m6A related gene characteristics, and the results show that the prognosis of genotype A is significantly better than that of genotype B (P = 0.023). (E) Expression of 23 m6A regulators in three gene clusters. The top and bottom of the box represent the quartile range of values, the lines in the box represent the median, and the colored dots represent outliers. The asterisk indicates the statistical p value (*P < 0.05; **P < 0.01; ***P < 0.001).