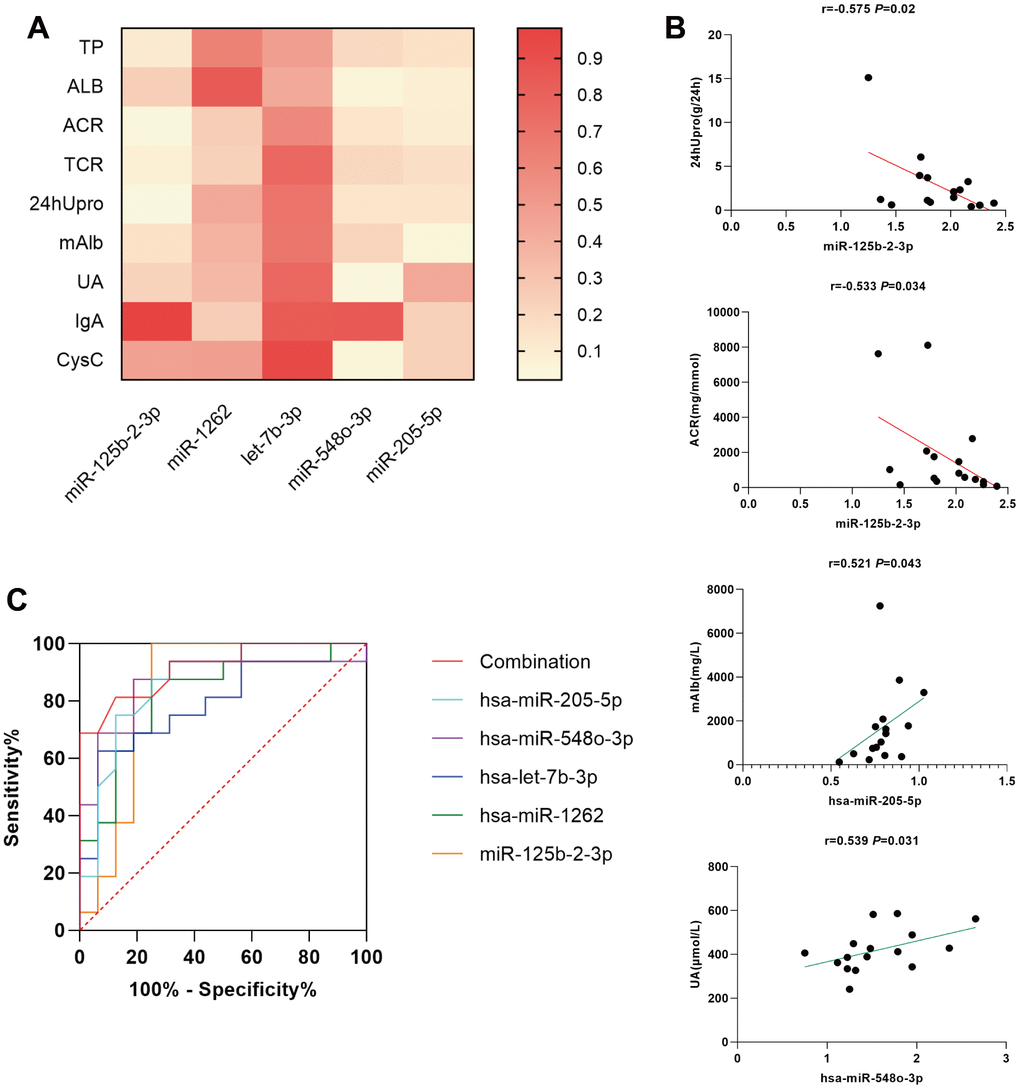
Figure 4.(A) simple linear regression between differentially expressed miRNAs and several clinical indicators in MsPGN patients. (B) Scatter diagram and linear correlation analysis. (C) Receiver operating characteristic (ROC) analysis of the combination of urinary exosomal miR-125b-2-3p, miR-1262, let-7b-3p, miR-548o-3p, and miR-205-5p for discriminating MsPGN. Plasma miRNAs yield an area under the ROC curve of 0.916.