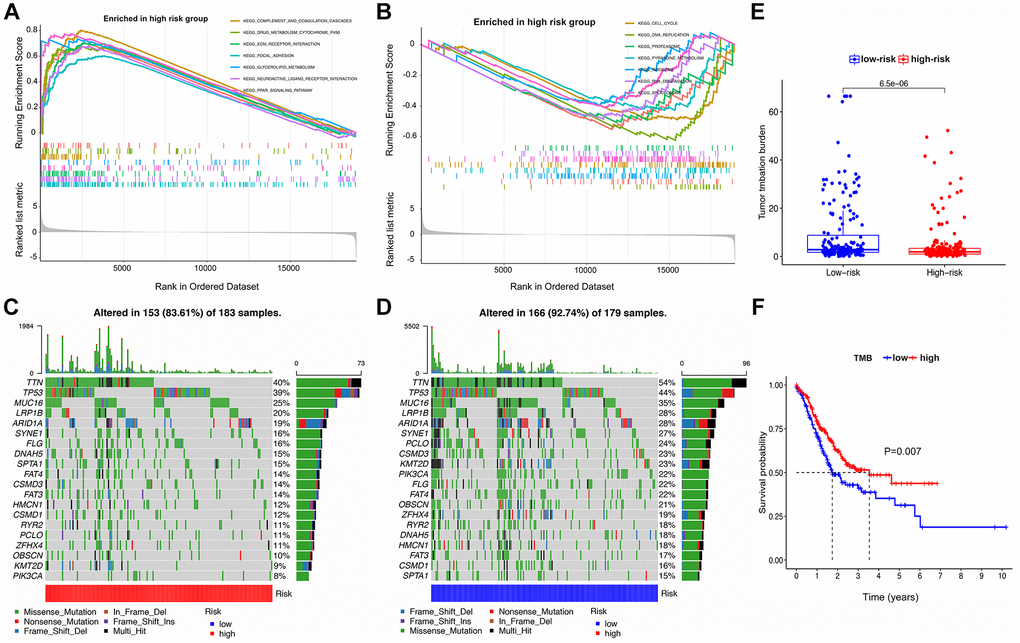
Figure 5.GSEA, mutational landscape, and TMB in high- and low-risk groups stratified by the IRS. (A, B) The enriched pathways for different risk groups based on GSEA analysis (C, D) Waterfall plot of the top 20 mutant genes in the high- and low-risk groups. (E) Box plot for the TMB between the high- and low-risk groups. (F) Kaplan-Meier survival curve of high versus low TMB.