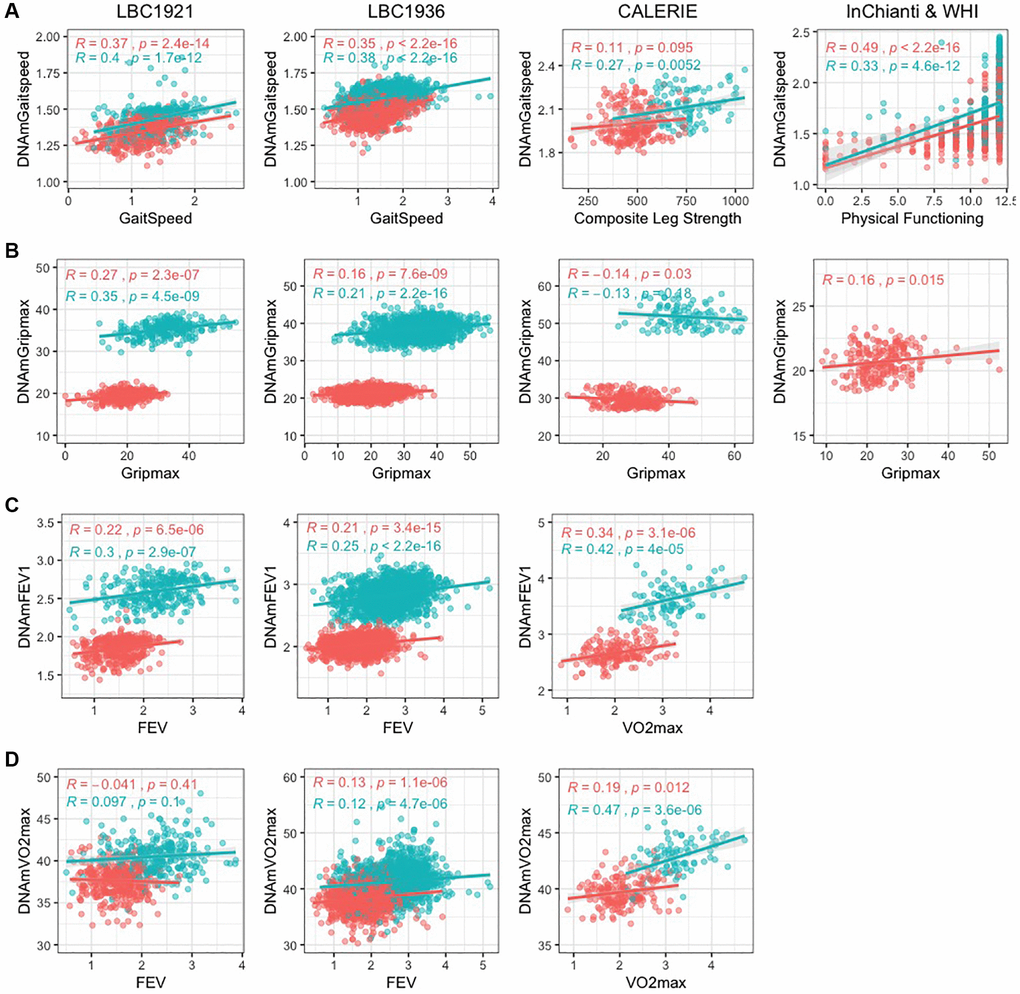
Figure 1.Scatterplots of DNAm fitness biomarker models versus true values in test datasets. Pink indicates females, and blue indicates males. When original variables were unavailable, best alternative variables are plotted against the DNAm fitness estimates. Each panel corresponds to the performance of one DNAm-based model built with chronological age across test datasets displayed with Pearson correlation and p-values. (A) DNAmGaitspeed with performance in InChianti dataset displayed, (B) DNAmGripmax with performance in WHI dataset, (C) DNAmFEV1, (D) DNAmVO2max. (A–C) (DNAmGaitspeed, DNAmGripmax, and DNAmFEV1) were built in each sex separately while (D) (DNAmVO2max) was built in both sexes jointly.